## Line Chart: ΔP vs. Layer for Mistral Models
### Overview
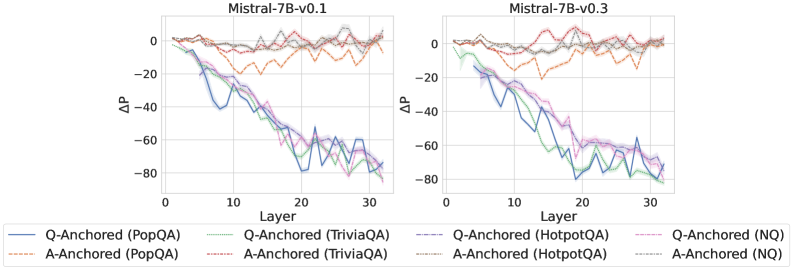
The image presents two line charts, side-by-side, comparing the change in probability (ΔP) across layers for different question-answering datasets using two versions of the Mistral-7B model (v0.1 and v0.3). The x-axis represents the layer number (0 to 30), and the y-axis represents ΔP, ranging from approximately 0 to -80. Each chart displays multiple lines, each representing a different question-answering dataset and anchoring method.
### Components/Axes
* **X-axis:** Layer (0 to 30)
* **Y-axis:** ΔP (Change in Probability)
* **Chart Titles:**
* Left Chart: "Mistral-7B-v0.1"
* Right Chart: "Mistral-7B-v0.3"
* **Legend:** Located at the bottom of the image, containing the following labels and corresponding line styles/colors:
* Q-Anchored (PopQA) - Blue Solid Line
* A-Anchored (PopQA) - Orange Dashed Line
* Q-Anchored (TriviaQA) - Green Solid Line
* A-Anchored (TriviaQA) - Purple Dashed Line
* Q-Anchored (HotpotQA) - Teal Dotted Line
* A-Anchored (HotpotQA) - Red Dotted Line
* Q-Anchored (NQ) - Cyan Solid Line
* A-Anchored (NQ) - Magenta Dashed Line
### Detailed Analysis or Content Details
**Mistral-7B-v0.1 (Left Chart):**
* **Q-Anchored (PopQA):** Starts at approximately 0, decreases steadily to around -60 at layer 20, and continues to decrease to approximately -75 at layer 30.
* **A-Anchored (PopQA):** Starts at approximately 0, decreases gradually to around -20 at layer 10, then plateaus around -30 to -40 from layer 15 to 30.
* **Q-Anchored (TriviaQA):** Starts at approximately 0, decreases rapidly to around -40 at layer 10, and continues to decrease to approximately -65 at layer 30.
* **A-Anchored (TriviaQA):** Starts at approximately 0, decreases gradually to around -20 at layer 10, then plateaus around -30 to -40 from layer 15 to 30.
* **Q-Anchored (HotpotQA):** Starts at approximately 0, decreases to around -20 at layer 10, and continues to decrease to approximately -50 at layer 30.
* **A-Anchored (HotpotQA):** Starts at approximately 0, remains relatively flat around -10 to 0 until layer 20, then decreases to approximately -30 at layer 30.
* **Q-Anchored (NQ):** Starts at approximately 0, decreases to around -20 at layer 10, and continues to decrease to approximately -55 at layer 30.
* **A-Anchored (NQ):** Starts at approximately 0, decreases gradually to around -20 at layer 10, then plateaus around -30 to -40 from layer 15 to 30.
**Mistral-7B-v0.3 (Right Chart):**
* **Q-Anchored (PopQA):** Starts at approximately 0, decreases steadily to around -50 at layer 20, and continues to decrease to approximately -70 at layer 30.
* **A-Anchored (PopQA):** Starts at approximately 0, decreases gradually to around -20 at layer 10, then plateaus around -30 to -40 from layer 15 to 30.
* **Q-Anchored (TriviaQA):** Starts at approximately 0, decreases rapidly to around -40 at layer 10, and continues to decrease to approximately -60 at layer 30.
* **A-Anchored (TriviaQA):** Starts at approximately 0, decreases gradually to around -20 at layer 10, then plateaus around -30 to -40 from layer 15 to 30.
* **Q-Anchored (HotpotQA):** Starts at approximately 0, decreases to around -20 at layer 10, and continues to decrease to approximately -50 at layer 30.
* **A-Anchored (HotpotQA):** Starts at approximately 0, remains relatively flat around -10 to 0 until layer 20, then decreases to approximately -30 at layer 30.
* **Q-Anchored (NQ):** Starts at approximately 0, decreases to around -20 at layer 10, and continues to decrease to approximately -50 at layer 30.
* **A-Anchored (NQ):** Starts at approximately 0, decreases gradually to around -20 at layer 10, then plateaus around -30 to -40 from layer 15 to 30.
### Key Observations
* In both charts, the "Q-Anchored" lines generally exhibit a steeper decline in ΔP compared to the "A-Anchored" lines.
* The "A-Anchored" lines tend to plateau after layer 10, indicating a stabilization of the change in probability.
* The datasets "PopQA", "TriviaQA", and "NQ" show similar trends, with "PopQA" generally having the most significant decrease in ΔP.
* "HotpotQA" shows a less pronounced decrease in ΔP compared to the other datasets.
* The v0.3 model generally shows a slightly more pronounced decrease in ΔP for the "Q-Anchored" lines compared to v0.1.
### Interpretation
The charts illustrate how the change in probability (ΔP) evolves across the layers of the Mistral-7B model for different question-answering datasets and anchoring methods. The negative ΔP values suggest a decreasing confidence or probability as the information propagates through the layers.
The steeper decline in ΔP for "Q-Anchored" lines suggests that anchoring the probability change to the question itself leads to a more significant reduction in confidence as the model processes the information. Conversely, anchoring to the answer ("A-Anchored") results in a more stable ΔP, indicating a sustained level of confidence.
The differences between datasets likely reflect the inherent difficulty and complexity of each dataset. "PopQA" showing the largest decrease suggests it is the most challenging for the model to process, leading to a greater reduction in confidence.
The slight differences between v0.1 and v0.3 suggest that the model improvements in v0.3 have a subtle impact on the ΔP trends, potentially indicating a more refined understanding of the question-answering process.
The plateaus observed in the "A-Anchored" lines could indicate that the model reaches a point where further processing does not significantly alter its confidence in the answer. This could be due to the model having extracted sufficient information to form a stable prediction.