## Line Chart: Model Layer Performance Comparison (Mistral-7B-v0.1 vs. v0.3)
### Overview
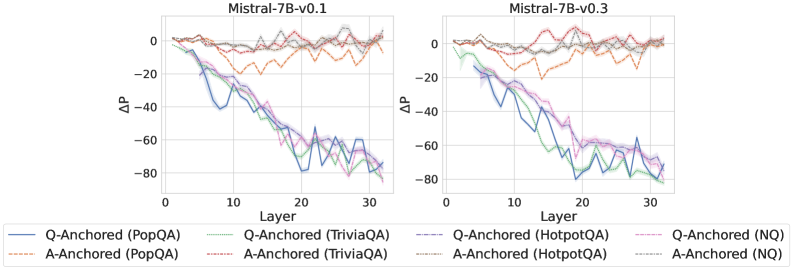
The image displays two side-by-side line charts comparing the performance change (ΔP) across model layers for two versions of the Mistral-7B model: "Mistral-7B-v0.1" (left plot) and "Mistral-7B-v0.3" (right plot). Each chart plots the performance metric ΔP against the model layer number (0 to 32) for eight different data series, representing two anchoring methods (Q-Anchored and A-Anchored) evaluated on four different question-answering datasets.
### Components/Axes
* **Chart Titles:**
* Left Plot: `Mistral-7B-v0.1`
* Right Plot: `Mistral-7B-v0.3`
* **X-Axis (Both Plots):**
* **Label:** `Layer`
* **Scale:** Linear, from 0 to 32. Major tick marks are at intervals of 10 (0, 10, 20, 30).
* **Y-Axis (Both Plots):**
* **Label:** `ΔP` (Delta P, likely representing a change in performance or probability).
* **Scale:** Linear, ranging from approximately -80 to +10. Major tick marks are at intervals of 20 (-80, -60, -40, -20, 0).
* **Legend (Bottom of Image, spanning both plots):**
* **Position:** Centered below the two charts.
* **Structure:** Two rows, four columns, listing eight series.
* **Series List (with approximate color and line style descriptions):**
1. `Q-Anchored (PopQA)` - Solid blue line.
2. `Q-Anchored (TriviaQA)` - Solid green line.
3. `Q-Anchored (HotpotQA)` - Dashed purple line.
4. `Q-Anchored (NQ)` - Solid pink/magenta line.
5. `A-Anchored (PopQA)` - Dashed orange line.
6. `A-Anchored (TriviaQA)` - Dashed red line.
7. `A-Anchored (HotpotQA)` - Dashed gray line.
8. `A-Anchored (NQ)` - Dotted light blue/cyan line.
### Detailed Analysis
**1. Mistral-7B-v0.1 (Left Plot):**
* **Q-Anchored Series (Solid/Dashed Blue, Green, Purple, Pink):** All four lines exhibit a strong, consistent downward trend. They start near ΔP = 0 at Layer 0 and decline steeply, reaching values between approximately -60 and -80 by Layer 32. The lines are tightly clustered, indicating similar degradation across datasets for the Q-Anchored method.
* **A-Anchored Series (Dashed Orange, Red, Gray; Dotted Cyan):** These lines show a markedly different pattern. They fluctuate around ΔP = 0, with no strong downward or upward trend across layers. The values generally stay within a band between -20 and +5. The `A-Anchored (PopQA)` (orange dashed) line shows slightly more volatility than the others.
**2. Mistral-7B-v0.3 (Right Plot):**
* **Q-Anchored Series:** The pattern is very similar to v0.1. All four lines show a pronounced downward trend from Layer 0 to Layer 32, ending in the -60 to -80 range. The clustering and slope appear nearly identical to the left plot.
* **A-Anchored Series:** These lines also remain relatively stable around ΔP = 0, fluctuating mostly between -20 and +5. The behavior is consistent with the v0.1 plot, showing no significant layer-wise degradation.
### Key Observations
1. **Clear Dichotomy:** There is a stark and consistent contrast between the two anchoring methods across both model versions. Q-Anchored performance (ΔP) degrades severely with increasing layer depth, while A-Anchored performance remains stable.
2. **Model Version Similarity:** The trends for both Q-Anchored and A-Anchored methods are remarkably similar between Mistral-7B-v0.1 and Mistral-7B-v0.3. This suggests the observed layer-wise behavior is a stable characteristic of the model architecture or the evaluation method, not an artifact fixed between these versions.
3. **Dataset Consistency:** Within each anchoring method, the four different datasets (PopQA, TriviaQA, HotpotQA, NQ) produce very similar trend lines. This indicates the observed effect is robust across different data sources.
4. **Volatility:** The A-Anchored lines, while stable in trend, exhibit more point-to-point volatility (jaggedness) compared to the smoother downward slope of the Q-Anchored lines.
### Interpretation
This visualization demonstrates a fundamental difference in how two types of "anchoring" (likely referring to how information is retrieved or attended to within the model) function across the layers of a large language model.
* **Q-Anchored (Question-Anchored?) Performance:** The steep negative slope suggests that as information propagates deeper into the model's layers, the model's ability to maintain or utilize the question-anchored signal diminishes significantly. By the final layers, the performance change is strongly negative. This could imply that deeper layers are less suited for, or actively interfere with, this specific mode of processing.
* **A-Anchored (Answer-Anchored?) Performance:** The stable, near-zero trend indicates that the answer-anchored signal is preserved or consistently processed throughout the model's depth. The model's layers do not systematically degrade this type of information.
* **Implication:** The data suggests a potential architectural or functional specialization within the model. The earlier layers may be crucial for processing question-anchored information, while the entire network maintains answer-anchored information. This could inform techniques for model editing, pruning, or understanding where different types of reasoning occur. The consistency across model versions (v0.1 to v0.3) and datasets strengthens the conclusion that this is a core behavioral property being measured. The "ΔP" metric, while not defined here, clearly captures a layer-sensitive phenomenon that differentiates these two anchoring strategies.