## Line Graph: ΔP vs. Layer for Mistral-7B-v0.1 and Mistral-7B-v0.3
### Overview
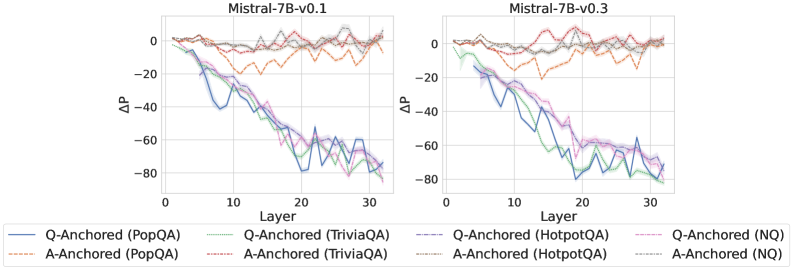
The image contains two side-by-side line graphs comparing the performance (ΔP) of different Q-Anchored and A-Anchored models across layers (0–30) in two versions of the Mistral-7B model (v0.1 and v0.3). Each graph includes multiple data series with distinct line styles and colors, representing different question-answering datasets (PopQA, TriviaQA, HotpotQA, NQ).
---
### Components/Axes
- **X-axis (Layer)**: Ranges from 0 to 30, labeled "Layer".
- **Y-axis (ΔP)**: Ranges from -80 to 0, labeled "ΔP".
- **Legends**:
- **Left Graph (v0.1)**:
- Solid blue: Q-Anchored (PopQA)
- Dashed orange: A-Anchored (PopQA)
- Solid green: Q-Anchored (TriviaQA)
- Dashed red: A-Anchored (TriviaQA)
- Solid purple: Q-Anchored (HotpotQA)
- Dashed pink: A-Anchored (HotpotQA)
- Solid gray: Q-Anchored (NQ)
- Dashed gray: A-Anchored (NQ)
- **Right Graph (v0.3)**:
- Same legend as v0.1, but with updated line trends.
---
### Detailed Analysis
#### Mistral-7B-v0.1 (Left Graph)
- **Q-Anchored (PopQA)**: Solid blue line starts near 0, drops sharply to ~-60 by layer 10, then fluctuates between -40 and -60.
- **A-Anchored (PopQA)**: Dashed orange line remains relatively stable, oscillating between ~-10 and 0.
- **Q-Anchored (TriviaQA)**: Solid green line starts near 0, drops to ~-50 by layer 10, then stabilizes.
- **A-Anchored (TriviaQA)**: Dashed red line fluctuates between ~-10 and 0.
- **Q-Anchored (HotpotQA)**: Solid purple line starts near 0, drops to ~-50 by layer 10, then stabilizes.
- **A-Anchored (HotpotQA)**: Dashed pink line fluctuates between ~-10 and 0.
- **Q-Anchored (NQ)**: Solid gray line starts near 0, drops to ~-60 by layer 10, then stabilizes.
- **A-Anchored (NQ)**: Dashed gray line fluctuates between ~-10 and 0.
#### Mistral-7B-v0.3 (Right Graph)
- **Q-Anchored (PopQA)**: Solid blue line starts near 0, drops to ~-50 by layer 10, then fluctuates between -30 and -50.
- **A-Anchored (PopQA)**: Dashed orange line remains stable, oscillating between ~-10 and 0.
- **Q-Anchored (TriviaQA)**: Solid green line starts near 0, drops to ~-40 by layer 10, then stabilizes.
- **A-Anchored (TriviaQA)**: Dashed red line fluctuates between ~-10 and 0.
- **Q-Anchored (HotpotQA)**: Solid purple line starts near 0, drops to ~-40 by layer 10, then stabilizes.
- **A-Anchored (HotpotQA)**: Dashed pink line fluctuates between ~-10 and 0.
- **Q-Anchored (NQ)**: Solid gray line starts near 0, drops to ~-50 by layer 10, then stabilizes.
- **A-Anchored (NQ)**: Dashed gray line fluctuates between ~-10 and 0.
---
### Key Observations
1. **Q-Anchored Models**:
- All Q-Anchored lines (PopQA, TriviaQA, HotpotQA, NQ) show a **sharp decline** in ΔP (from ~0 to ~-40 to -60) in the first 10 layers, followed by stabilization.
- In v0.3, the decline is slightly less severe than in v0.1.
2. **A-Anchored Models**:
- All A-Anchored lines (PopQA, TriviaQA, HotpotQA, NQ) remain **relatively stable**, with minor fluctuations around ~-10 to 0.
3. **Version Differences**:
- v0.3 shows **reduced variability** in Q-Anchored models compared to v0.1, suggesting improved stability in later layers.
- A-Anchored models show **no significant change** between versions.
---
### Interpretation
- **Q-Anchored vs. A-Anchored**:
- Q-Anchored models exhibit **greater sensitivity to layer changes**, leading to larger ΔP variations. This suggests they may be more prone to overfitting or instability in early layers.
- A-Anchored models demonstrate **consistent performance**, indicating robustness across layers.
- **Version Impact**:
- The reduction in ΔP variability in v0.3 (compared to v0.1) implies architectural improvements in Mistral-7B, particularly in stabilizing Q-Anchored models.
- **Dataset-Specific Trends**:
- PopQA and NQ show the **most pronounced declines** in Q-Anchored models, possibly due to their complexity or data distribution.
- TriviaQA and HotpotQA exhibit **moderate declines**, suggesting they are less sensitive to layer-specific variations.
---
### Notes on Data Extraction
- All values are approximate, as the graph lacks explicit numerical markers.
- Line styles (solid/dashed) and colors (blue, orange, green, red, purple, gray) are strictly matched to the legend.
- No text or tables are present in the image beyond the axes, legends, and titles.
This analysis highlights the trade-offs between Q-Anchored and A-Anchored models in terms of stability and performance across layers, with version updates favoring Q-Anchored models in later iterations.