# Technical Document Extraction: Cosine Similarity Across Model Layers
## 1. Component Isolation
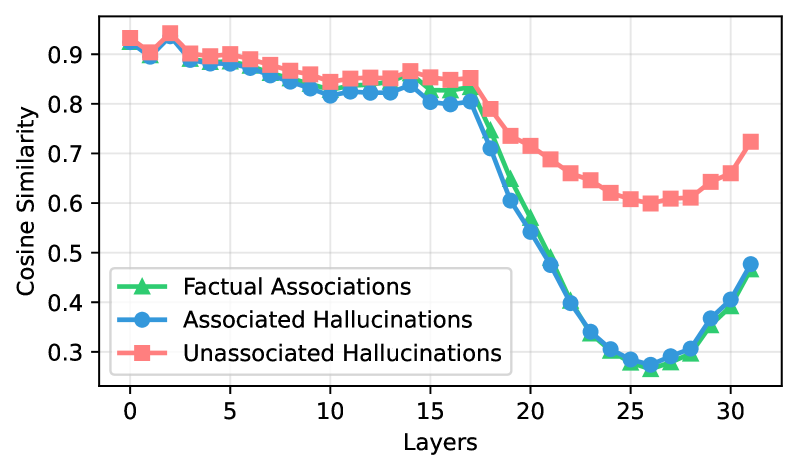
* **Header:** None present.
* **Main Chart Area:** A line graph with three distinct data series plotted against a grid.
* **Legend:** Located in the bottom-left quadrant of the chart area.
* **Axes:**
* **Y-Axis (Vertical):** Labeled "Cosine Similarity", ranging from 0.3 to 0.9.
* **X-Axis (Horizontal):** Labeled "Layers", ranging from 0 to 30 (with data points extending to 31).
## 2. Legend and Data Series Identification
The legend is positioned at approximately `[x=0.05, y=0.15]` relative to the chart axes.
| Series Label | Color | Marker Shape | Visual Trend Description |
| :--- | :--- | :--- | :--- |
| **Factual Associations** | Green | Triangle ($\blacktriangle$) | High stability (0.9 to 0.8) until layer 17, followed by a sharp "V" shaped plunge and recovery. |
| **Associated Hallucinations** | Blue | Circle ($\bullet$) | Closely tracks "Factual Associations" throughout the entire model depth, showing near-identical behavior. |
| **Unassociated Hallucinations** | Red/Pink | Square ($\blacksquare$) | Maintains higher similarity than other series; follows the same downward trend after layer 17 but with a much shallower trough. |
## 3. Data Extraction and Trend Analysis
### General Trends
* **Layers 0–17 (Initial Phase):** All three categories maintain high cosine similarity, starting near 0.93 and gradually drifting down to approximately 0.82. There is a minor "sawtooth" oscillation in the first 5 layers.
* **Layers 18–26 (Divergence Phase):** A significant drop occurs. "Factual Associations" and "Associated Hallucinations" collapse rapidly from ~0.8 to a minimum of ~0.27. "Unassociated Hallucinations" also drop but remain significantly higher, bottoming out at ~0.6.
* **Layers 27–31 (Recovery Phase):** All three series show an upward trajectory toward the final layer, suggesting a convergence or re-alignment of representations at the model's output.
### Estimated Data Points
*Values are estimated based on axis markers and grid alignment.*
| Layer | Factual Associations (Green $\blacktriangle$) | Associated Hallucinations (Blue $\bullet$) | Unassociated Hallucinations (Red $\blacksquare$) |
| :--- | :--- | :--- | :--- |
| 0 | 0.92 | 0.92 | 0.93 |
| 5 | 0.88 | 0.88 | 0.90 |
| 10 | 0.82 | 0.82 | 0.85 |
| 15 | 0.82 | 0.80 | 0.85 |
| 17 | 0.82 | 0.80 | 0.85 |
| 20 | 0.55 | 0.54 | 0.72 |
| 25 | 0.28 | 0.29 | 0.61 |
| 26 | 0.27 (Min) | 0.28 (Min) | 0.60 (Min) |
| 30 | 0.39 | 0.40 | 0.66 |
| 31 | 0.47 | 0.48 | 0.72 |
## 4. Technical Observations
* **High Correlation:** There is an extremely high correlation between "Factual Associations" and "Associated Hallucinations." Their lines are nearly overlapping for the duration of the 32 layers.
* **The "Layer 17" Threshold:** Layer 17 marks a critical transition point where the internal representations of the model undergo a drastic transformation, specifically reducing the cosine similarity of factual and associated hallucinated content.
* **Resilience of Unassociated Hallucinations:** The "Unassociated Hallucinations" series is the most "stable" in terms of cosine similarity, as it does not experience the same degree of collapse in the middle-to-late layers as the other two categories.