## Line Chart: Cosine Similarity vs. Layers
### Overview
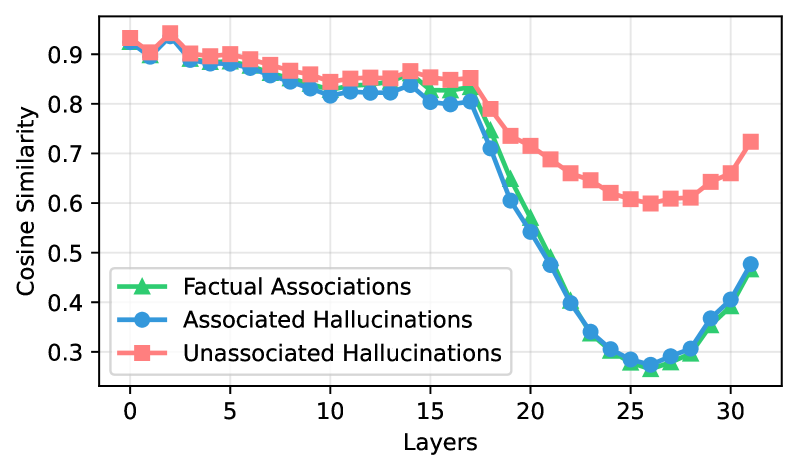
The image presents a line chart illustrating the relationship between the number of layers in a model and the cosine similarity scores for three different types of associations: Factual Associations, Associated Hallucinations, and Unassociated Hallucinations. The chart appears to be evaluating the impact of model depth on the quality of generated associations.
### Components/Axes
* **X-axis:** "Layers" - ranging from approximately 0 to 32.
* **Y-axis:** "Cosine Similarity" - ranging from approximately 0.3 to 0.95.
* **Legend:** Located in the bottom-left corner.
* "Factual Associations" - represented by a green line with triangle markers.
* "Associated Hallucinations" - represented by a blue line with circle markers.
* "Unassociated Hallucinations" - represented by a red line with square markers.
* **Grid:** A light gray grid is present in the background to aid in reading values.
### Detailed Analysis
* **Unassociated Hallucinations (Red Line):** This line starts at approximately 0.92 at Layer 0, and generally decreases with a slight fluctuation until Layer 20, where it drops sharply. From Layer 20 to Layer 32, it remains relatively stable, fluctuating between approximately 0.62 and 0.68.
* **Associated Hallucinations (Blue Line):** This line begins at approximately 0.84 at Layer 0, and decreases steadily until Layer 20, where it experiences a dramatic drop. From Layer 20 to Layer 32, it increases again, starting from approximately 0.28 and reaching approximately 0.42.
* **Factual Associations (Green Line):** This line starts at approximately 0.75 at Layer 0, and remains relatively stable until Layer 18, where it begins to decrease. It reaches a minimum of approximately 0.28 at Layer 25, and then increases again, reaching approximately 0.4 at Layer 32.
**Specific Data Points (Approximate):**
| Layers | Factual Associations | Associated Hallucinations | Unassociated Hallucinations |
|---|---|---|---|
| 0 | 0.75 | 0.84 | 0.92 |
| 5 | 0.78 | 0.82 | 0.90 |
| 10 | 0.77 | 0.80 | 0.88 |
| 15 | 0.76 | 0.78 | 0.85 |
| 20 | 0.65 | 0.28 | 0.65 |
| 25 | 0.28 | 0.30 | 0.63 |
| 30 | 0.38 | 0.40 | 0.65 |
| 32 | 0.40 | 0.42 | 0.67 |
### Key Observations
* All three lines exhibit a decreasing trend in cosine similarity up to approximately Layer 20.
* The "Associated Hallucinations" and "Unassociated Hallucinations" lines experience a significant drop around Layer 20, while "Factual Associations" begins a more gradual decline.
* After Layer 20, the "Associated Hallucinations" line shows a slight increase, while the other two lines remain relatively stable or continue to fluctuate.
* "Unassociated Hallucinations" consistently have the highest cosine similarity scores throughout the observed range of layers.
### Interpretation
The data suggests that as the number of layers in the model increases, the cosine similarity between the model's associations and factual information decreases, while the tendency towards hallucinations (both associated and unassociated) initially decreases, but then potentially increases again at deeper layers. The sharp drop around Layer 20 could indicate a point of instability or a transition in the model's behavior. The fact that "Unassociated Hallucinations" maintain higher similarity scores suggests that the model is more prone to generating associations that are not grounded in factual information, even as it becomes deeper. The slight increase in "Associated Hallucinations" after Layer 20 might indicate that the model starts to form more complex, but potentially inaccurate, connections as it gains depth. This could be a sign of overfitting or the emergence of spurious correlations. The chart highlights a trade-off between model depth and the quality of generated associations, suggesting that there may be an optimal number of layers beyond which the benefits of increased depth are outweighed by the risk of hallucinations.