## Line Graph: Cosine Similarity Across Layers
### Overview
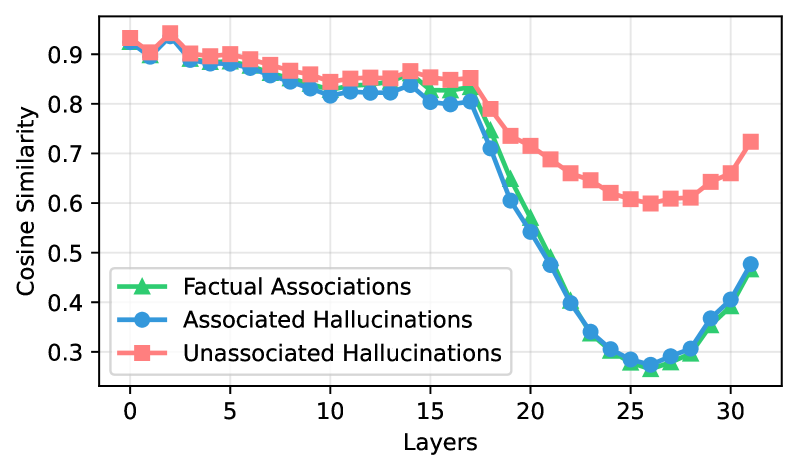
The image depicts a line graph comparing three metrics—Factual Associations, Associated Hallucinations, and Unassociated Hallucinations—across 30 layers. Cosine similarity values range from 0.3 to 0.9, with all three metrics starting near 0.9 at layer 0 and diverging significantly by layer 30.
### Components/Axes
- **X-axis (Layers)**: Labeled "Layers," with ticks at intervals of 5 (0, 5, 10, ..., 30).
- **Y-axis (Cosine Similarity)**: Labeled "Cosine Similarity," scaled from 0.3 to 0.9 in increments of 0.1.
- **Legend**: Located in the bottom-left corner, with:
- Green triangles: Factual Associations
- Blue circles: Associated Hallucinations
- Red squares: Unassociated Hallucinations
### Detailed Analysis
1. **Factual Associations (Green)**:
- Starts at ~0.9 at layer 0.
- Declines gradually to ~0.8 by layer 15.
- Drops sharply to ~0.3 by layer 25.
- Recovers to ~0.45 by layer 30.
2. **Associated Hallucinations (Blue)**:
- Mirrors Factual Associations closely until layer 15 (~0.8).
- Declines to ~0.3 by layer 25.
- Recovers to ~0.45 by layer 30.
3. **Unassociated Hallucinations (Red)**:
- Starts at ~0.9 at layer 0.
- Declines to ~0.85 by layer 15.
- Drops sharply to ~0.6 by layer 20.
- Reaches a trough of ~0.3 at layer 25.
- Recovers to ~0.7 by layer 30.
### Key Observations
- All three metrics exhibit a **sharp decline** between layers 15–20, with Unassociated Hallucinations showing the most pronounced drop.
- By layer 25, all metrics converge near the lowest similarity value (~0.3).
- A **recovery phase** occurs between layers 25–30, with Unassociated Hallucinations rebounding more steeply than the others.
- The green (Factual) and blue (Associated) lines remain closely aligned throughout, while the red (Unassociated) line diverges significantly after layer 15.
### Interpretation
The data suggests that **cosine similarity decreases as layers increase**, indicating reduced alignment or consistency in associations across deeper layers. The sharp decline around layer 15–20 may reflect a critical transition point in the model's behavior, such as a shift in feature representation or loss of interpretability. The recovery in later layers (25–30) could imply stabilization or compensatory mechanisms. Notably, Unassociated Hallucinations exhibit greater volatility, hinting at distinct dynamics in these associations compared to factual or associated ones. This divergence might highlight challenges in disentangling spurious correlations in deeper layers.