## Diagram: Information Architecture Tree
### Overview
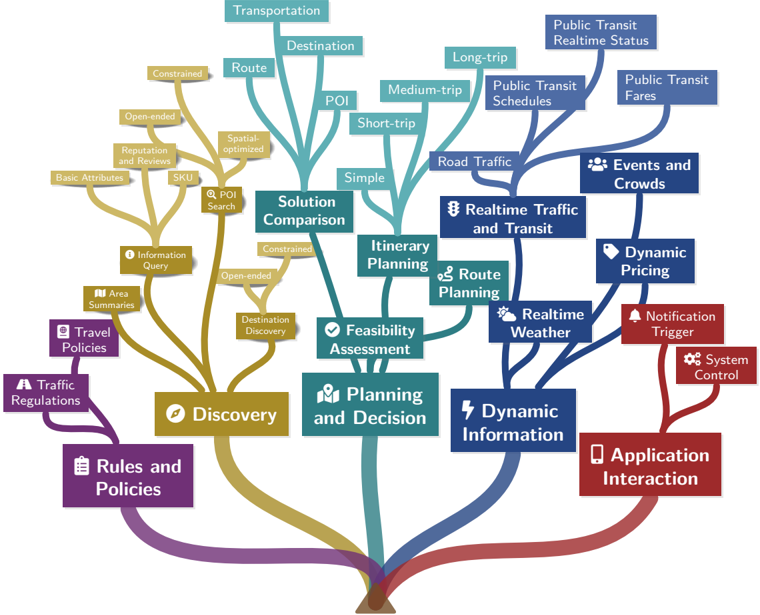
The image presents an information architecture diagram in the form of a tree. The root of the tree represents core functionalities, which branch out into more specific features and data points. The diagram uses color-coding to categorize different aspects of the system.
### Components/Axes
* **Root Nodes:**
* Rules and Policies (Purple)
* Discovery (Gold)
* Planning and Decision (Teal)
* Dynamic Information (Blue)
* Application Interaction (Red)
* **Branches and Sub-Nodes:** Each root node branches out into several sub-nodes, representing specific features, data points, or functionalities.
### Detailed Analysis or ### Content Details
**1. Rules and Policies (Purple):**
* Trend: The purple branch represents rules and policies.
* Sub-Nodes:
* Traffic Regulations (bottom-left)
* Travel Policies (above Traffic Regulations)
**2. Discovery (Gold):**
* Trend: The gold branch represents the discovery aspect.
* Sub-Nodes:
* Area Summaries (left)
* Information Query (above Area Summaries)
* Basic Attributes (top-left)
* Reputation and Reviews (above Basic Attributes)
* SKU (to the right of Reputation and Reviews)
* Open-ended (above SKU)
* Constrained (above Open-ended)
* POI Search (right)
* Spatial-optimized (above POI Search)
* Destination Discovery (bottom-right)
* Open-ended (above Destination Discovery)
* Constrained (above Open-ended)
* Solution Comparison (center-right)
**3. Planning and Decision (Teal):**
* Trend: The teal branch represents planning and decision-making.
* Sub-Nodes:
* Feasibility Assessment (left)
* Itinerary Planning (above Feasibility Assessment)
* Route Planning (to the right of Itinerary Planning)
* Simple (top-center)
* Short-trip (above Simple)
* Medium-trip (above Short-trip)
* Long-trip (above Medium-trip)
* Transportation (top)
* Destination (above Transportation)
* Route (to the right of Destination)
* POI (below Destination)
**4. Dynamic Information (Blue):**
* Trend: The blue branch represents dynamic information.
* Sub-Nodes:
* Realtime Weather (left)
* Realtime Traffic and Transit (above Realtime Weather)
* Road Traffic (above Realtime Traffic and Transit)
* Events and Crowds (top-right)
* Public Transit Fares (above Events and Crowds)
* Public Transit Schedules (to the left of Public Transit Fares)
* Public Transit Realtime Status (above Public Transit Schedules)
* Dynamic Pricing (right)
**5. Application Interaction (Red):**
* Trend: The red branch represents application interaction.
* Sub-Nodes:
* System Control (top-right)
* Notification Trigger (above System Control)
### Key Observations
* The diagram visually organizes different aspects of a system or application.
* The color-coding helps to differentiate between the main categories.
* The branching structure shows the relationships between high-level concepts and more granular details.
### Interpretation
The diagram provides a high-level overview of the information architecture for a system, likely related to travel or urban planning. It highlights the key areas of functionality and the data points that are relevant to each area. The structure suggests a hierarchical relationship between the core functions (Rules/Policies, Discovery, Planning/Decision, Dynamic Information, Application Interaction) and their respective components. The diagram is useful for understanding the scope of the system and how different parts are interconnected.
```