## Concept Diagram: Transportation & Mobility Services Taxonomy
### Overview
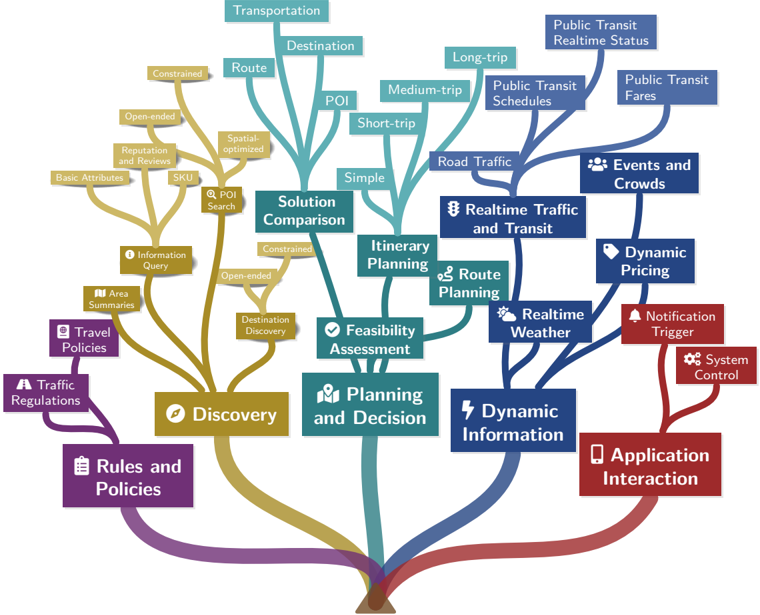
The image is a conceptual tree diagram or mind map illustrating a taxonomy of services and functions related to transportation, mobility, and trip planning. The diagram uses a tree structure with a central trunk at the bottom that branches out into five major, color-coded categories. Each major branch further subdivides into more specific functions and data types. The visual metaphor suggests that all these services grow from a common root or foundation.
### Components/Axes
The diagram is structured as a hierarchical tree with no traditional axes. The primary organizational elements are:
* **Central Trunk:** A brown, root-like structure at the bottom center from which all major branches originate.
* **Major Branches (Primary Categories):** Five thick, colored branches extending from the trunk. Each has a primary label and an associated icon.
1. **Rules and Policies** (Purple, bottom-left): Icon of a document.
2. **Discovery** (Gold, left): Icon of a compass.
3. **Planning and Decision** (Teal, center): Icon of a person with a map.
4. **Dynamic Information** (Blue, right): Icon of a lightning bolt.
5. **Application Interaction** (Red, bottom-right): Icon of a smartphone.
* **Sub-Branches:** Thinner lines of the same color as the parent branch, leading to more specific service categories or data types.
* **Leaf Nodes:** Rectangular boxes containing the specific service or data labels. Some have small icons preceding the text.
### Detailed Analysis
The diagram details a comprehensive ecosystem of mobility-related services. Here is a breakdown by major branch:
**1. Rules and Policies (Purple Branch - Bottom Left)**
* **Sub-Branch:** `Traffic Regulations`
* **Leaf Node:** `Travel Policies`
**2. Discovery (Gold Branch - Left)**
* **Sub-Branches & Leaf Nodes:**
* `Area Summaries`
* `Information Query`
* `POI Search` (with a magnifying glass icon)
* `Destination Discovery`
* `Solution Comparison` (This node is also connected to the "Planning and Decision" branch via a teal line, indicating a cross-functional relationship).
* **Further Sub-Categories (from `POI Search` and `Information Query`):**
* `Basic Attributes`
* `Reputation and Reviews`
* `SKU`
* `Spatial-optimized`
* `Open-ended`
* `Constrained`
**3. Planning and Decision (Teal Branch - Center)**
* **Sub-Branches & Leaf Nodes:**
* `Feasibility Assessment`
* `Itinerary Planning`
* `Route Planning` (with a map icon)
* **Further Sub-Categories (from `Itinerary Planning`):**
* `Simple`
* `Short-trip`
* `Medium-trip`
* `Long-trip`
* **Further Sub-Categories (from `Route Planning`):**
* `Transportation`
* `Destination`
* `Route`
* `POI` (Point of Interest)
**4. Dynamic Information (Blue Branch - Right)**
* **Sub-Branches & Leaf Nodes:**
* `Realtime Weather` (with a cloud/sun icon)
* `Realtime Traffic and Transit` (with a traffic light icon)
* `Road Traffic`
* `Public Transit Schedules`
* `Public Transit Realtime Status`
* `Public Transit Fares`
* `Events and Crowds` (with a people icon)
* `Dynamic Pricing` (with a price tag icon)
**5. Application Interaction (Red Branch - Bottom Right)**
* **Sub-Branches & Leaf Nodes:**
* `Notification Trigger` (with a bell icon)
* `System Control` (with a gear icon)
### Key Observations
* **Cross-Functional Link:** The `Solution Comparison` node is uniquely connected to both the **Discovery** (gold) and **Planning and Decision** (teal) branches, highlighting its role as a bridge between finding options and making a choice.
* **Hierarchical Depth:** The **Discovery** and **Planning and Decision** branches show the most hierarchical depth, with up to three levels of sub-categorization (e.g., Planning and Decision -> Itinerary Planning -> Short-trip).
* **Iconography:** Small icons are used consistently to visually reinforce the meaning of key service categories (e.g., lightning bolt for dynamic data, smartphone for app interaction).
* **Spatial Layout:** The **Rules and Policies** and **Application Interaction** branches are positioned at the bottom corners, framing the core functional branches (Discovery, Planning, Dynamic Info) which occupy the central and upper space of the diagram.
### Interpretation
This diagram presents a structured ontology for a smart mobility or transportation-as-a-service (TaaS) platform. It categorizes the vast array of data inputs, processing functions, and user-facing features required for such a system.
* **What it demonstrates:** The taxonomy moves from foundational, rule-based constraints (left) through user-centric processes of discovery and planning (center), fueled by real-time data (right), and culminating in actionable outputs and controls (bottom-right). It illustrates that effective trip planning is not a single action but an ecosystem of interconnected services.
* **Relationships:** The central positioning of **Planning and Decision** suggests it is the core processing engine, relying on inputs from **Discovery** (options) and **Dynamic Information** (real-world conditions), while operating within the boundaries set by **Rules and Policies**. The final outputs are delivered and managed through **Application Interaction**.
* **Notable Insight:** The inclusion of `Dynamic Pricing`, `Events and Crowds`, and `Realtime Status` underscores the importance of temporal, real-time data in modern mobility solutions, moving beyond static schedules and maps. The separation of `Public Transit` into schedules, realtime status, and fares indicates a sophisticated level of data integration for public transport.