## Line Chart: Max and Min Values Across Layer Indices
### Overview
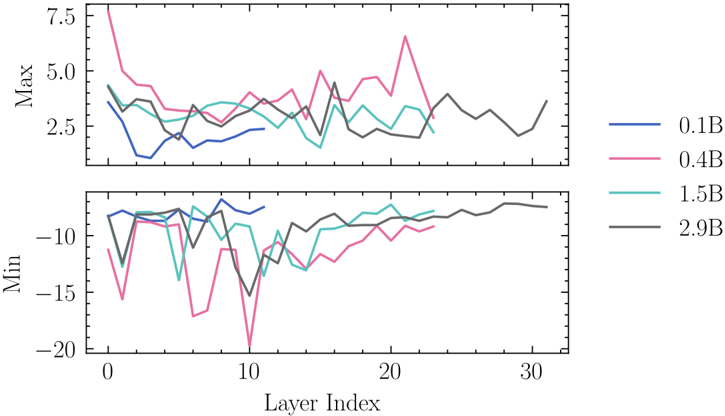
The image contains a dual-axis line chart comparing maximum (top subplot) and minimum (bottom subplot) values across 31 layer indices (0–30). Four data series are represented by distinct colors, each corresponding to a specific "B" parameter value (0.1B, 0.4B, 1.5B, 2.9B). The chart emphasizes volatility patterns in both peak and trough behaviors across different configurations.
### Components/Axes
- **X-axis (Layer Index)**:
- Range: 0 to 30 (integer increments)
- Label: "Layer Index"
- **Y-axes**:
- Top subplot ("Max"):
- Range: -20 to 7.5 (approximate)
- Label: "Max"
- Bottom subplot ("Min"):
- Range: -20 to 0 (approximate)
- Label: "Min"
- **Legend**:
- Position: Right of the chart
- Entries:
- Blue: 0.1B
- Pink: 0.4B
- Teal: 1.5B
- Black: 2.9B
### Detailed Analysis
#### Max Subplot Trends
1. **0.1B (Blue)**:
- Starts at ~5.0 (Layer 0), drops sharply to ~2.5 by Layer 5, then fluctuates between 2.0–4.0 until Layer 30.
- Notable: Sharp dip at Layer 5 (~2.5), recovery to ~4.0 by Layer 10.
2. **0.4B (Pink)**:
- Begins at ~7.5 (Layer 0), with extreme volatility: peaks at ~7.0 (Layer 2), troughs at ~2.0 (Layer 5), and sharp spikes to ~6.0 (Layer 15).
- Ends at ~3.0 (Layer 30).
3. **1.5B (Teal)**:
- Stable oscillations between 3.0–5.0, with minor dips to ~2.5 (Layer 15).
- Ends at ~4.0 (Layer 30).
4. **2.9B (Black)**:
- Most stable series: fluctuates between 3.0–4.5, with a gradual upward trend from ~3.5 (Layer 0) to ~4.5 (Layer 30).
#### Min Subplot Trends
1. **0.1B (Blue)**:
- Starts at ~-10, plunges to ~-15 (Layer 5), then stabilizes between -10 and -12.
- Sharpest drop at Layer 5.
2. **0.4B (Pink)**:
- Begins at ~-12, drops to ~-18 (Layer 5), then fluctuates between -14 and -16.
- Sharpest drop at Layer 5.
3. **1.5B (Teal)**:
- Moderate stability: oscillates between -10 and -14, with a slight recovery to ~-12 by Layer 30.
4. **2.9B (Black)**:
- Smoothest series: starts at ~-10, dips to ~-12 (Layer 5), then stabilizes between -11 and -13.
### Key Observations
1. **Volatility Correlation**:
- Lower B values (0.1B, 0.4B) exhibit significantly higher volatility in both Max and Min values compared to higher B values (1.5B, 2.9B).
2. **Extreme Fluctuations**:
- The 0.4B series (pink) shows the most extreme peaks (~7.5) and troughs (~-18), suggesting heightened sensitivity to layer index changes.
3. **Stability Trends**:
- 2.9B (black) demonstrates the most consistent behavior, with minimal deviation in both subplots.
4. **Layer 5 Anomaly**:
- All series experience pronounced dips at Layer 5, indicating a potential systemic factor affecting this layer.
### Interpretation
The data suggests that higher B values (e.g., 2.9B) correlate with greater stability in both maximum and minimum outcomes, likely due to optimized parameter tuning or reduced sensitivity to layer-specific variations. Conversely, lower B values (0.1B, 0.4B) display erratic behavior, with 0.4B showing the most extreme fluctuations. The consistent dip at Layer 5 across all series hints at a shared underlying mechanism or constraint in this layer. The 2.9B configuration’s stability makes it a candidate for robust applications requiring predictable performance, while the 0.4B series may require further investigation into its instability drivers.