## Scatter Plots: Principal Component Analysis Across Recurrent Steps
### Overview
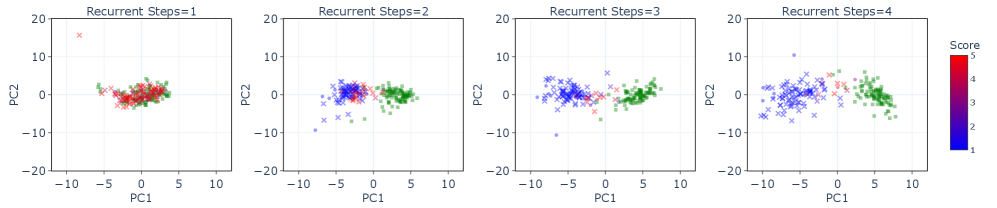
The image displays four scatter plots arranged horizontally, each representing Principal Component Analysis (PCA) results for data points categorized by "Recurrent Steps" (1–4). Each plot uses PC1 (x-axis) and PC2 (y-axis) to visualize data distribution, with a color gradient (red to blue) indicating a "Score" scale from 5 (high) to 1 (low). The plots show evolving patterns as recurrent steps increase.
---
### Components/Axes
- **X-axis (PC1)**: Principal Component 1, ranging from -10 to 10.
- **Y-axis (PC2)**: Principal Component 2, ranging from -20 to 20.
- **Legend**: Color gradient labeled "Score" (red = 5, blue = 1), positioned on the right of all plots.
- **Panel Titles**:
- Top-left: "Recurrent Steps=1"
- Top-center-left: "Recurrent Steps=2"
- Top-center-right: "Recurrent Steps=3"
- Top-right: "Recurrent Steps=4"
---
### Detailed Analysis
#### Recurrent Steps=1
- **Data Distribution**: Dense cluster of points near the origin (PC1 ≈ 0, PC2 ≈ 0).
- **Color Distribution**: Predominantly red (score ≈ 4–5) with sparse green (score ≈ 3).
- **Trend**: Tight clustering suggests high similarity among data points.
#### Recurrent Steps=2
- **Data Distribution**: Slightly dispersed cluster, with points spreading toward PC1 ≈ -5 to 5 and PC2 ≈ -5 to 5.
- **Color Distribution**: Mix of blue (score ≈ 1–2), red (score ≈ 4–5), and green (score ≈ 3).
- **Trend**: Increased variability compared to Steps=1, with some overlap between high and low scores.
#### Recurrent Steps=3
- **Data Distribution**: Further spread, with points extending to PC1 ≈ -10 to 10 and PC2 ≈ -10 to 10.
- **Color Distribution**: Balanced mix of blue (score ≈ 1–2), red (score ≈ 4–5), and green (score ≈ 3).
- **Trend**: Moderate clustering, indicating intermediate data diversity.
#### Recurrent Steps=4
- **Data Distribution**: Widest spread, with points scattered across PC1 ≈ -10 to 10 and PC2 ≈ -20 to 10.
- **Color Distribution**: Dominant blue (score ≈ 1–2) and green (score ≈ 3), with fewer red points.
- **Trend**: Significant dispersion, suggesting reduced similarity among data points.
---
### Key Observations
1. **Clustering Tightness**: Data points cluster more tightly at lower recurrent steps (Steps=1–2) and disperse as steps increase (Steps=3–4).
2. **Score Correlation**: Higher scores (red) dominate early steps but diminish in prevalence as steps increase.
3. **Dimensional Spread**: PC2 range widens from Steps=1 (≈ -5 to 5) to Steps=4 (≈ -20 to 10), indicating increased variance in the second principal component.
---
### Interpretation
The plots suggest that increasing recurrent steps introduces greater variability in the data, as evidenced by the expanding spread of points. The decline in high-scoring (red) data points with more steps may indicate a trade-off between model complexity (more steps) and performance (lower scores). The PCA results imply that early steps capture more cohesive patterns, while later steps reveal fragmented or diverse features. This could reflect overfitting or noise amplification in models with higher recurrent steps.