## Scatter Plot Matrix: Recurrent Steps vs. PC1 and PC2
### Overview
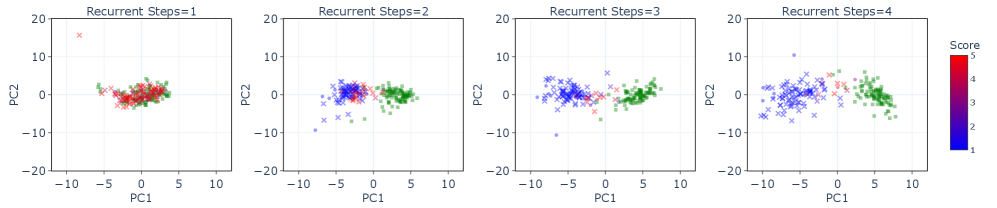
The image presents a series of four scatter plots arranged horizontally. Each plot visualizes the relationship between two principal components (PC1 and PC2) for a different number of recurrent steps (1, 2, 3, and 4). The data points are color-coded based on a "Score" ranging from 1 (blue) to 5 (red). The plots aim to show how the distribution of data points changes as the number of recurrent steps increases.
### Components/Axes
* **Titles:** Each plot has a title indicating the number of recurrent steps: "Recurrent Steps=1", "Recurrent Steps=2", "Recurrent Steps=3", and "Recurrent Steps=4".
* **Axes:**
* X-axis: PC1 (Principal Component 1), ranging from approximately -10 to 10.
* Y-axis: PC2 (Principal Component 2), ranging from approximately -20 to 20.
* **Data Points:** Data points are represented as 'x' markers and squares.
* **Color Scale (Legend):** Located on the right side of the image, the color scale represents the "Score" with values ranging from 1 to 5. The color gradient goes from blue (1) to red (5).
* **Gridlines:** Each plot has faint gridlines to aid in reading the data point locations.
### Detailed Analysis
**1. Recurrent Steps = 1**
* The data points are clustered mainly around the origin (0,0).
* The majority of points are colored red and green, indicating scores around 4 and 5.
* There is a small cluster of red points (score ~5) located around PC1 = -8 and PC2 = 15.
* Trend: Data is concentrated near the origin with a few outliers.
**2. Recurrent Steps = 2**
* The data points start to spread out more compared to the first plot.
* A distinct cluster of blue points (score ~1) appears around PC1 = -5 and PC2 = 0.
* Green points (score ~5) are clustered around PC1 = 5 and PC2 = 0.
* Trend: Data begins to separate into distinct clusters based on score.
**3. Recurrent Steps = 3**
* The blue cluster (score ~1) becomes more prominent and shifts slightly towards the left.
* The green cluster (score ~5) remains relatively stable.
* Trend: The separation of clusters based on score becomes more defined.
**4. Recurrent Steps = 4**
* The blue cluster (score ~1) is now well-defined and located around PC1 = -7 and PC2 = 2.
* The green cluster (score ~5) is located around PC1 = 5 and PC2 = 2.
* Trend: Clear separation of data points into distinct clusters based on score.
### Key Observations
* As the number of recurrent steps increases, the data points become more separated into distinct clusters based on their "Score".
* The blue cluster (score ~1) becomes more prominent and shifts towards negative PC1 values with increasing recurrent steps.
* The green cluster (score ~5) remains relatively stable in terms of its location.
* The red points (score ~4) are less concentrated and more scattered compared to the blue and green clusters.
### Interpretation
The plots suggest that the number of recurrent steps influences the separation and distribution of data points in the PC1-PC2 space, based on the "Score". With more recurrent steps, the model is better able to differentiate between data points with different scores, leading to more distinct clusters. The shift of the blue cluster (score ~1) towards negative PC1 values might indicate a specific characteristic or feature associated with that score that becomes more pronounced with increasing recurrent steps. The stability of the green cluster (score ~5) could imply that these data points are already well-defined even with fewer recurrent steps.