## Diagram: Graph Representation
### Overview
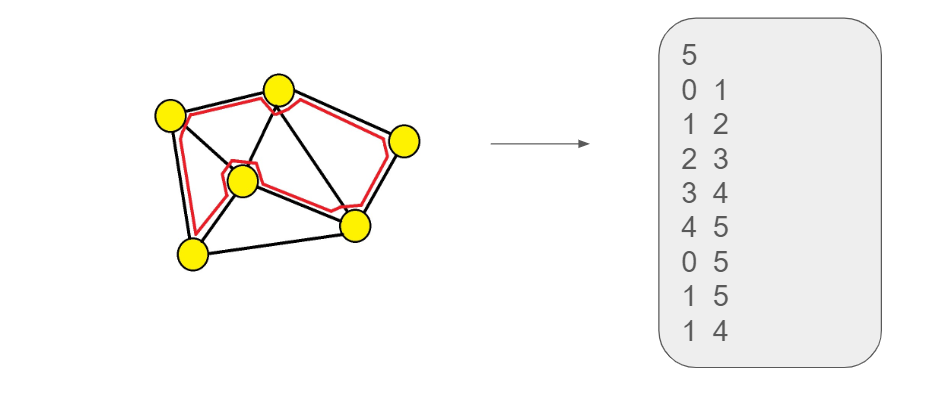
The image depicts a graph structure and its representation as a list of edges. The graph consists of nodes (represented as yellow circles) connected by edges (black lines). A red line highlights a specific path or cycle within the graph. An arrow points from the graph to a rounded rectangle containing a list of number pairs, representing the edges of the graph.
### Components/Axes
* **Nodes:** Represented by yellow circles. There are 6 nodes in total.
* **Edges:** Represented by black lines connecting the nodes.
* **Highlighted Path/Cycle:** Represented by a red line tracing a path through the graph.
* **Edge List:** A rounded rectangle containing a list of number pairs.
* **Arrow:** Indicates the relationship between the graph and the edge list.
### Detailed Analysis or ### Content Details
**Graph Structure:**
* The graph has 6 nodes, visually arranged in a somewhat circular fashion.
* The nodes are connected by black edges, forming a network.
* A red line highlights a specific path or cycle within the graph. This path visits nodes in the following sequence (approximately): Node 0 -> Node 1 -> Node 2 -> Node 3 -> Node 4 -> Node 5 -> Node 0.
**Edge List:**
The rounded rectangle contains the following list of number pairs, representing the edges of the graph:
* 5 0
* 0 1
* 1 2
* 2 3
* 3 4
* 4 5
* 0 5
* 1 5
* 1 4
### Key Observations
* The edge list corresponds to the connections between the nodes in the graph.
* The red line highlights a cycle that includes all nodes.
* The edge list provides a numerical representation of the graph's connectivity.
### Interpretation
The image illustrates how a graph structure can be represented as a list of edges. The graph itself provides a visual representation of the relationships between nodes, while the edge list provides a more formal, numerical representation. The red line highlights a specific path or cycle within the graph, which could be of interest for various graph algorithms or analyses. The edge list accurately reflects the connections shown in the graph diagram.