## Bar Chart: RMS Error vs. iSNR for BIL and SRP
### Overview
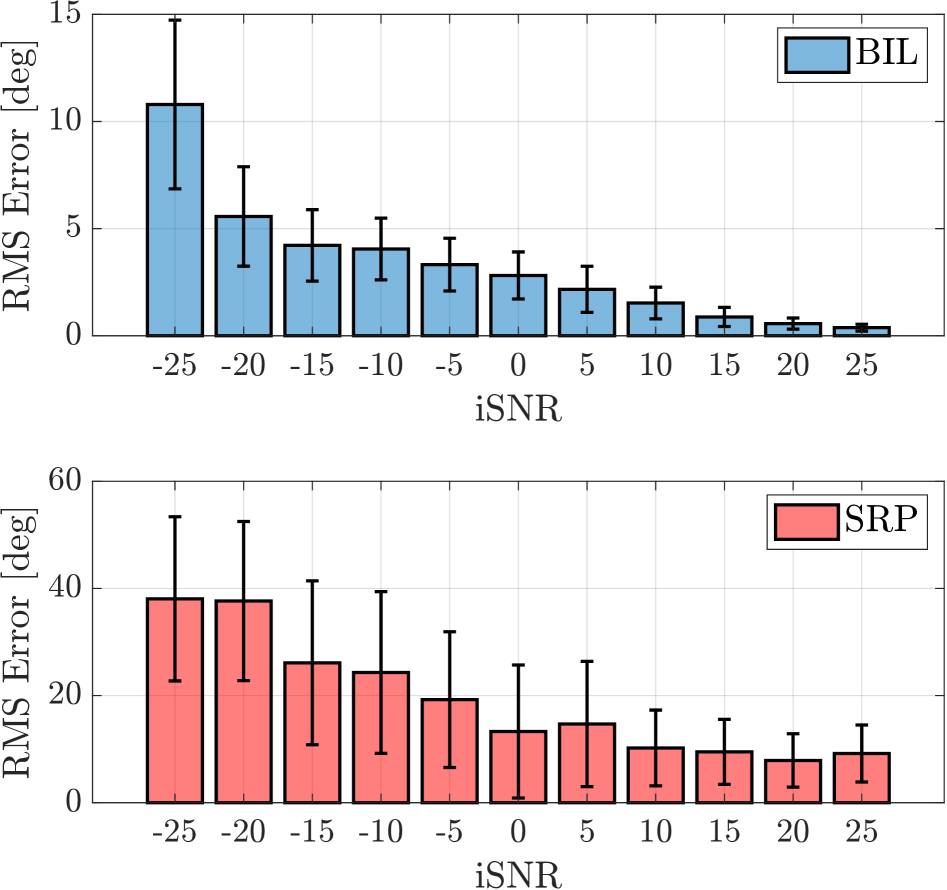
The image presents two bar charts, one above the other, comparing the Root Mean Square (RMS) error in degrees ([deg]) against the input Signal-to-Noise Ratio (iSNR) for two different algorithms: BIL (top chart, blue bars) and SRP (bottom chart, red bars). The x-axis (iSNR) ranges from -25 to 25. Error bars are included on each bar, indicating variability.
### Components/Axes
* **Top Chart:**
* **Y-axis:** RMS Error [deg], ranging from 0 to 15.
* **X-axis:** iSNR, ranging from -25 to 25 in increments of 5.
* **Legend:** BIL (blue bars). Located in the top-right corner.
* **Bottom Chart:**
* **Y-axis:** RMS Error [deg], ranging from 0 to 60.
* **X-axis:** iSNR, ranging from -25 to 25 in increments of 5.
* **Legend:** SRP (red bars). Located in the top-right corner.
### Detailed Analysis
**Top Chart (BIL):**
* **Trend:** The RMS Error generally decreases as iSNR increases.
* At iSNR = -25, RMS Error is approximately 11 deg.
* At iSNR = -20, RMS Error is approximately 5.5 deg.
* At iSNR = -15, RMS Error is approximately 4 deg.
* At iSNR = -10, RMS Error is approximately 4 deg.
* At iSNR = -5, RMS Error is approximately 3.2 deg.
* At iSNR = 0, RMS Error is approximately 2.2 deg.
* At iSNR = 5, RMS Error is approximately 1.7 deg.
* At iSNR = 10, RMS Error is approximately 1.4 deg.
* At iSNR = 15, RMS Error is approximately 0.8 deg.
* At iSNR = 20, RMS Error is approximately 0.6 deg.
* At iSNR = 25, RMS Error is approximately 0.5 deg.
**Bottom Chart (SRP):**
* **Trend:** The RMS Error generally decreases as iSNR increases.
* At iSNR = -25, RMS Error is approximately 38 deg.
* At iSNR = -20, RMS Error is approximately 38 deg.
* At iSNR = -15, RMS Error is approximately 25 deg.
* At iSNR = -10, RMS Error is approximately 24 deg.
* At iSNR = -5, RMS Error is approximately 19 deg.
* At iSNR = 0, RMS Error is approximately 13 deg.
* At iSNR = 5, RMS Error is approximately 14 deg.
* At iSNR = 10, RMS Error is approximately 10 deg.
* At iSNR = 15, RMS Error is approximately 9 deg.
* At iSNR = 20, RMS Error is approximately 7 deg.
* At iSNR = 25, RMS Error is approximately 9 deg.
### Key Observations
* The RMS Error for the BIL algorithm is significantly lower than that of the SRP algorithm across all iSNR values.
* Both algorithms show a trend of decreasing RMS Error with increasing iSNR.
* The error bars indicate the variability in the RMS Error for each iSNR value.
### Interpretation
The charts demonstrate that the BIL algorithm performs significantly better than the SRP algorithm in terms of RMS error across the tested iSNR range. As the iSNR increases (i.e., the signal becomes stronger relative to the noise), the RMS error decreases for both algorithms, which is expected. The error bars provide insight into the consistency of the results; larger error bars suggest greater variability in the RMS error for a given iSNR. The BIL algorithm consistently maintains a lower error rate, suggesting it is more robust to noise than the SRP algorithm under these conditions.