## Bar Chart: RMS Error vs. iSNR for BIL and SRP Methods
### Overview
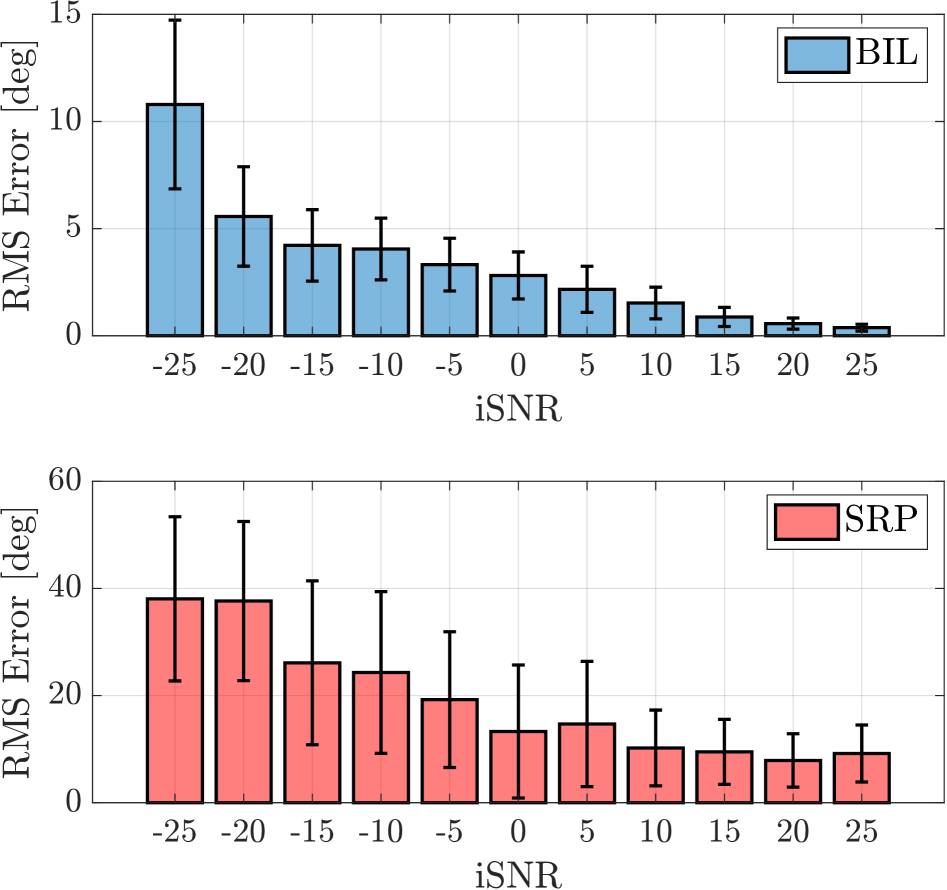
The image contains two vertically stacked bar charts comparing RMS error (in degrees) across varying iSNR values for two methods: BIL (blue bars) and SRP (red bars). Each bar includes error bars representing uncertainty. The x-axis spans iSNR values from -25 to 25, while the y-axes for BIL and SRP range from 0–15° and 0–60°, respectively.
### Components/Axes
- **X-axis**: Labeled "iSNR" with tick marks at -25, -20, -15, -10, -5, 0, 5, 10, 15, 20, 25.
- **Y-axis (Top Chart)**: Labeled "RMS Error [deg]" (0–15°) for BIL.
- **Y-axis (Bottom Chart)**: Labeled "RMS Error [deg]" (0–60°) for SRP.
- **Legend**: Located in the top-right corner, with blue representing BIL and red representing SRP.
- **Error Bars**: Vertical lines atop each bar indicating measurement uncertainty.
### Detailed Analysis
#### BIL Method (Top Chart)
- **iSNR = -25**: RMS error ≈ 10.5° ± 3.2° (error bar length).
- **iSNR = -20**: RMS error ≈ 5.2° ± 1.8°.
- **iSNR = -15**: RMS error ≈ 4.1° ± 1.5°.
- **iSNR = -10**: RMS error ≈ 3.8° ± 1.2°.
- **iSNR = -5**: RMS error ≈ 3.0° ± 0.9°.
- **iSNR = 0**: RMS error ≈ 2.5° ± 0.7°.
- **iSNR = 5**: RMS error ≈ 2.1° ± 0.6°.
- **iSNR = 10**: RMS error ≈ 1.5° ± 0.4°.
- **iSNR = 15**: RMS error ≈ 1.0° ± 0.3°.
- **iSNR = 20**: RMS error ≈ 0.7° ± 0.2°.
- **iSNR = 25**: RMS error ≈ 0.4° ± 0.1°.
#### SRP Method (Bottom Chart)
- **iSNR = -25**: RMS error ≈ 38.0° ± 6.5°.
- **iSNR = -20**: RMS error ≈ 37.5° ± 6.2°.
- **iSNR = -15**: RMS error ≈ 25.0° ± 5.0°.
- **iSNR = -10**: RMS error ≈ 23.0° ± 4.8°.
- **iSNR = -5**: RMS error ≈ 18.0° ± 4.0°.
- **iSNR = 0**: RMS error ≈ 12.0° ± 3.5°.
- **iSNR = 5**: RMS error ≈ 13.0° ± 3.2°.
- **iSNR = 10**: RMS error ≈ 10.0° ± 2.8°.
- **iSNR = 15**: RMS error ≈ 9.0° ± 2.5°.
- **iSNR = 20**: RMS error ≈ 8.0° ± 2.2°.
- **iSNR = 25**: RMS error ≈ 9.0° ± 2.0°.
### Key Observations
1. **BIL vs. SRP**: BIL consistently shows lower RMS errors than SRP across all iSNR values.
2. **iSNR Dependency**: Both methods exhibit higher RMS errors at lower iSNR values (-25 to -5), with errors decreasing as iSNR increases.
3. **Uncertainty Trends**: Error bars are longest at lower iSNR values, indicating greater variability in measurements under poor signal conditions.
4. **SRP Anomaly**: SRP’s RMS error at iSNR = 25 (9.0°) is higher than at iSNR = 20 (8.0°), suggesting a potential non-monotonic relationship at high iSNR.
### Interpretation
The data demonstrates that the BIL method outperforms SRP in terms of RMS error across all tested iSNR values. The pronounced error reduction in BIL at lower iSNR (-25 to -5) highlights its robustness in low-signal environments. The SRP method’s higher errors and non-monotonic trend at high iSNR (20–25) may indicate overfitting or sensitivity to noise in high-signal conditions. The error bars underscore the importance of iSNR in determining measurement reliability, with lower iSNR values associated with greater uncertainty. These findings suggest BIL is preferable for applications requiring accuracy across diverse signal conditions, while SRP may require refinement for high-iSNR scenarios.