# Technical Document Extraction: Speedup Analysis for Vicuna-7B
## 1. Document Overview
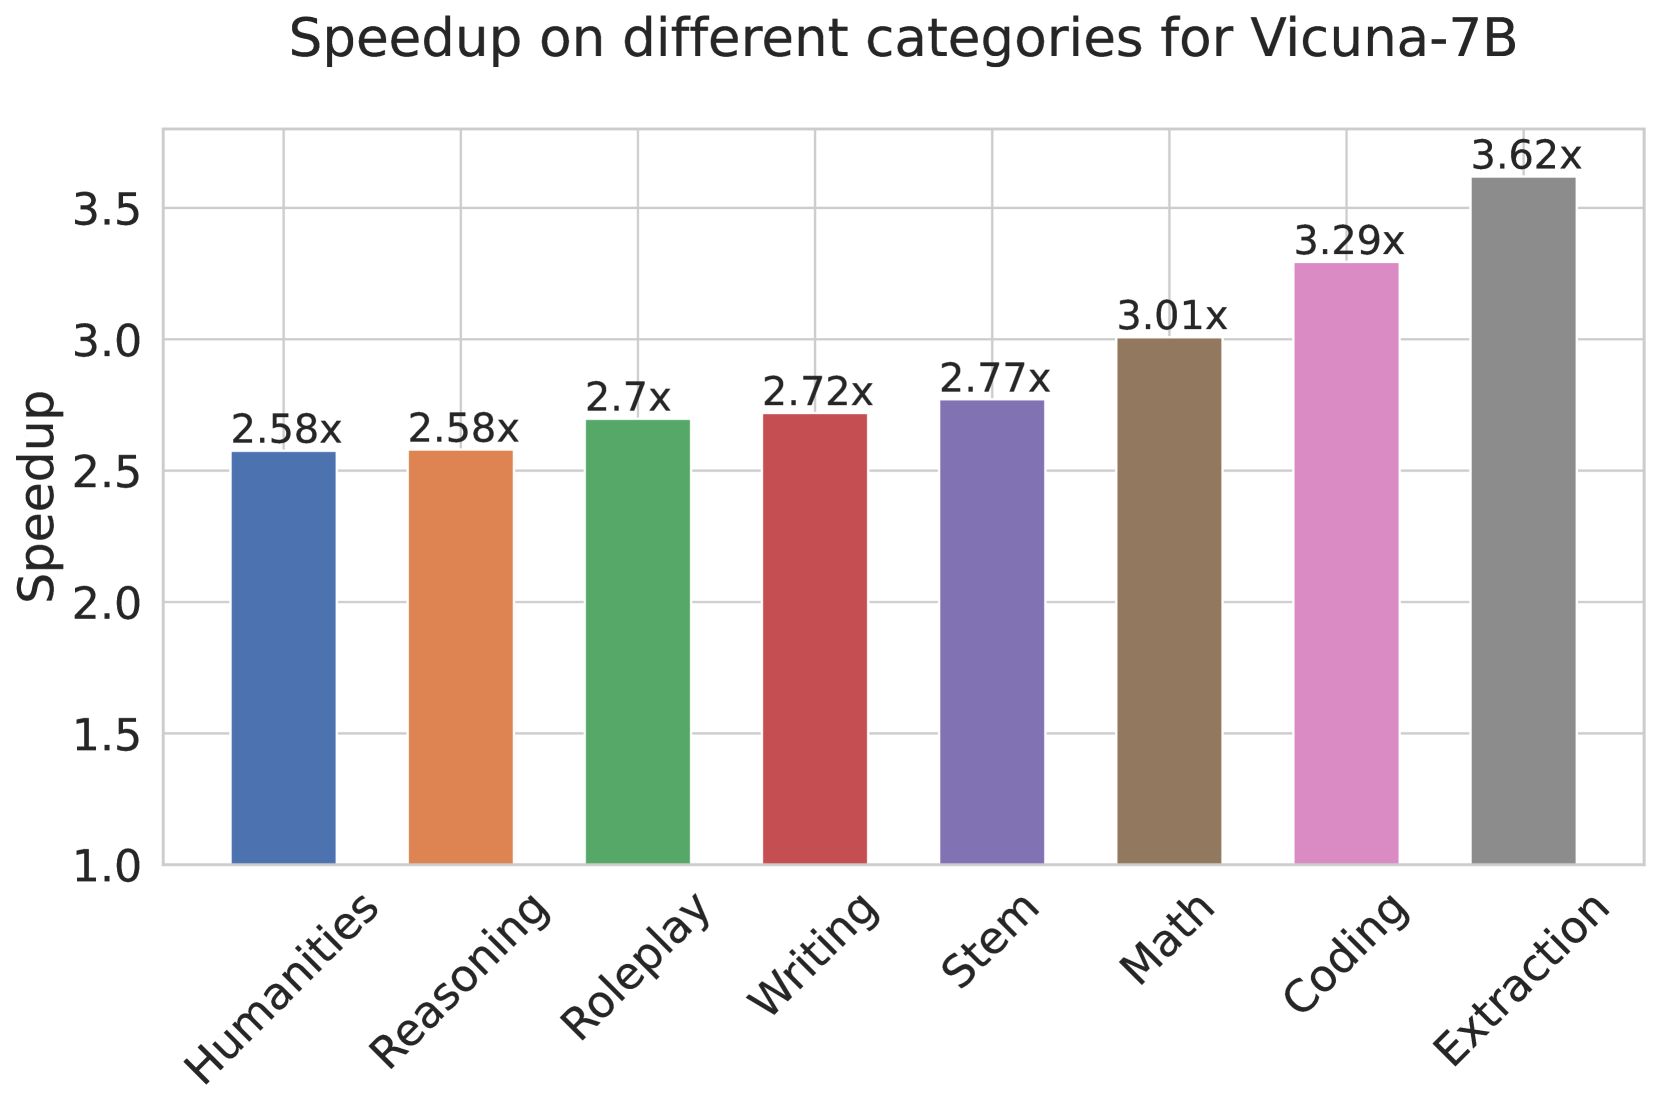
This image is a vertical bar chart illustrating the performance "Speedup" achieved across eight different task categories for the large language model **Vicuna-7B**. The chart uses a multi-colored categorical scheme to differentiate between the task types.
## 2. Component Isolation
### Header
- **Title:** Speedup on different categories for Vicuna-7B
### Main Chart Area
- **Y-Axis Label:** Speedup
- **Y-Axis Scale:** Numerical range from 1.0 to 3.5 (with the highest data point extending to ~3.62). Major gridlines are present at intervals of 0.5 (1.0, 1.5, 2.0, 2.5, 3.0, 3.5).
- **X-Axis Labels:** Eight categorical task types, rotated approximately 45 degrees for readability.
- **Data Visualization:** Eight vertical bars, each topped with a precise numerical value label.
## 3. Data Table Extraction
The following table reconstructs the visual data presented in the bar chart.
| Category | Speedup Value | Bar Color |
| :--- | :--- | :--- |
| Humanities | 2.58x | Blue |
| Reasoning | 2.58x | Orange |
| Roleplay | 2.7x | Green |
| Writing | 2.72x | Red |
| Stem | 2.77x | Purple |
| Math | 3.01x | Brown |
| Coding | 3.29x | Pink |
| Extraction | 3.62x | Grey |
## 4. Trend Verification and Analysis
The chart is organized in ascending order of speedup from left to right.
* **Initial Plateau:** The first two categories, **Humanities** and **Reasoning**, show identical performance gains at **2.58x**.
* **Steady Incremental Growth:** From **Roleplay (2.7x)** through **Stem (2.77x)**, there is a gradual upward slope in performance.
* **Significant Acceleration:** There is a notable jump in speedup when moving into technical and structured data tasks. **Math** breaks the 3.0x threshold (**3.01x**), followed by a sharp increase in **Coding (3.29x)**.
* **Peak Performance:** The **Extraction** category exhibits the highest speedup at **3.62x**, which is approximately 40% higher than the baseline speedup seen in the Humanities category.
## 5. Spatial Grounding and Labels
* **X-Axis [Bottom]:** Labels are centered under each bar.
* **Y-Axis [Left]:** "Speedup" text is oriented vertically.
* **Data Labels [Top of Bars]:** Each bar has its specific "Nx" value printed directly above the colored region to ensure precision beyond the gridlines.
* **Language:** The entire chart is in **English**. No other languages are present.