## Chart: Per-Period Regret vs. Time Period for Different Agents
### Overview
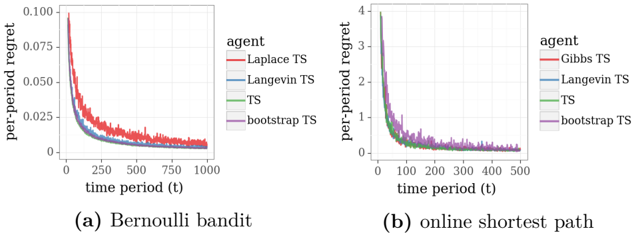
The image contains two line charts comparing the per-period regret of different agents over time. The left chart (a) shows results for a Bernoulli bandit problem, while the right chart (b) shows results for an online shortest path problem. Both charts display the per-period regret on the y-axis and the time period (t) on the x-axis. The performance of four different agents (Laplace TS/Gibbs TS, Langevin TS, TS, and bootstrap TS) are compared in each chart.
### Components/Axes
**Left Chart (a) Bernoulli bandit:**
* **Title:** (a) Bernoulli bandit
* **X-axis:** time period (t), ranging from 0 to 1000
* **Y-axis:** per-period regret, ranging from 0 to 0.100
* **Legend (top-right):**
* Red: Laplace TS
* Blue: Langevin TS
* Green: TS
* Purple: bootstrap TS
**Right Chart (b) online shortest path:**
* **Title:** (b) online shortest path
* **X-axis:** time period (t), ranging from 0 to 500
* **Y-axis:** per-period regret, ranging from 0 to 4
* **Legend (top-right):**
* Red: Gibbs TS
* Blue: Langevin TS
* Green: TS
* Purple: bootstrap TS
### Detailed Analysis
**Left Chart (a) Bernoulli bandit:**
* **Laplace TS (Red):** The per-period regret starts at approximately 0.1 and decreases rapidly, reaching approximately 0.02 around time period 250, then gradually decreases to approximately 0.01 by time period 1000.
* **Langevin TS (Blue):** The per-period regret starts at approximately 0.05 and decreases rapidly, reaching approximately 0.01 around time period 250, then remains relatively stable.
* **TS (Green):** The per-period regret starts at approximately 0.075 and decreases rapidly, reaching approximately 0.01 around time period 250, then remains relatively stable.
* **bootstrap TS (Purple):** The per-period regret starts at approximately 0.075 and decreases rapidly, reaching approximately 0.01 around time period 250, then remains relatively stable.
**Right Chart (b) online shortest path:**
* **Gibbs TS (Red):** The per-period regret starts at approximately 4 and decreases rapidly, reaching approximately 0.5 around time period 100, then gradually decreases to approximately 0.2 by time period 500.
* **Langevin TS (Blue):** The per-period regret starts at approximately 2 and decreases rapidly, reaching approximately 0.25 around time period 100, then remains relatively stable.
* **TS (Green):** The per-period regret starts at approximately 3 and decreases rapidly, reaching approximately 0.5 around time period 100, then remains relatively stable.
* **bootstrap TS (Purple):** The per-period regret starts at approximately 2 and decreases rapidly, reaching approximately 0.5 around time period 100, then remains relatively stable.
### Key Observations
* In both charts, all agents exhibit a rapid decrease in per-period regret during the initial time periods.
* In the Bernoulli bandit problem, the Laplace TS agent initially has a higher regret but converges to a similar level as the other agents.
* In the online shortest path problem, the Gibbs TS agent initially has a higher regret but converges to a higher level than the other agents.
* The Langevin TS, TS, and bootstrap TS agents show similar performance in both problems after the initial rapid decrease in regret.
### Interpretation
The charts demonstrate the learning behavior of different Thompson Sampling (TS) based agents in two different problem settings: Bernoulli bandit and online shortest path. The initial rapid decrease in per-period regret indicates that all agents are effectively learning to make better decisions over time. The differences in initial regret and convergence levels suggest that the choice of agent can impact performance, particularly in the early stages of learning. The Laplace TS and Gibbs TS agents, which use different sampling strategies, exhibit distinct behaviors compared to the other agents. The Langevin TS, TS, and bootstrap TS agents show relatively consistent performance across both problem settings, suggesting that they are robust to changes in the environment.