## [Line Charts]: Per-Period Regret Comparison for Two Reinforcement Learning Tasks
### Overview
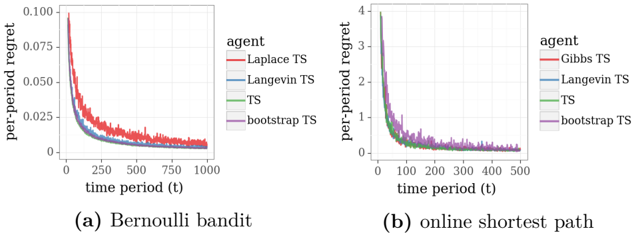
The image displays two side-by-side line charts comparing the performance of four different Thompson Sampling (TS) agent variants on two distinct reinforcement learning tasks. The charts plot "per-period regret" against "time period (t)", showing how the regret (a measure of suboptimal performance) decreases as the agents learn over time. The left chart (a) is for a "Bernoulli bandit" problem, and the right chart (b) is for an "online shortest path" problem.
### Components/Axes
**Common Elements (Both Charts):**
* **Y-axis Label:** `per-period regret`
* **X-axis Label:** `time period (t)`
* **Legend (Positioned to the right of each chart):** Lists four agents with corresponding line colors.
* `Laplace TS` - Red line
* `Langevin TS` - Blue line
* `TS` - Green line
* `bootstrap TS` - Purple line
**Chart (a) Specifics:**
* **Title/Caption (Below chart):** `(a) Bernoulli bandit`
* **Y-axis Scale:** Linear scale from 0.000 to 0.100, with major ticks at 0.000, 0.025, 0.050, 0.075, 0.100.
* **X-axis Scale:** Linear scale from 0 to 1000, with major ticks at 0, 250, 500, 750, 1000.
**Chart (b) Specifics:**
* **Title/Caption (Below chart):** `(b) online shortest path`
* **Y-axis Scale:** Linear scale from 0 to 4, with major ticks at 0, 1, 2, 3, 4.
* **X-axis Scale:** Linear scale from 0 to 500, with major ticks at 0, 100, 200, 300, 400, 500.
### Detailed Analysis
**Chart (a) - Bernoulli Bandit:**
* **Trend Verification:** All four lines show a steep, near-exponential decay in per-period regret from time t=0, followed by a gradual flattening as they approach t=1000.
* **Data Series & Approximate Values:**
* **Laplace TS (Red):** Starts highest, near 0.100 at t=0. Decays rapidly, crossing below 0.025 around t=250. Appears to converge to a value slightly above 0.005 by t=1000.
* **Langevin TS (Blue):** Starts slightly below Laplace TS. Follows a very similar decay path, converging to a nearly identical final value as Laplace TS.
* **TS (Green):** Starts lower than Laplace and Langevin TS. Decays quickly and appears to converge to the lowest final value among the four, very close to 0.000.
* **bootstrap TS (Purple):** Starts at a level similar to TS. Its decay path is slightly noisier (more jagged) than the others. Converges to a value slightly higher than TS but lower than Laplace/Langevin TS.
**Chart (b) - Online Shortest Path:**
* **Trend Verification:** All four lines again show a sharp initial decrease in regret, but the scale is an order of magnitude larger than in chart (a). The decay is very rapid within the first 50-100 time periods.
* **Data Series & Approximate Values:**
* **Laplace TS (Red), Langevin TS (Blue), TS (Green):** These three lines are tightly clustered. They start near a regret value of 4 at t=0. By t=100, all have fallen below 1. By t=500, they appear to converge to a value very close to 0.
* **bootstrap TS (Purple):** This line starts at a similar point (~4) but exhibits noticeably higher regret than the other three agents during the initial learning phase (approximately t=0 to t=150). It eventually converges to the same near-zero level as the others by t=500.
### Key Observations
1. **Scale Difference:** The magnitude of per-period regret is vastly different between the two tasks. The Bernoulli bandit problem (a) has a maximum regret ~0.1, while the online shortest path problem (b) has a maximum regret ~4. This indicates the shortest path task is significantly more challenging or has a larger penalty for suboptimal actions.
2. **Convergence:** All algorithms in both tasks successfully learn, as evidenced by regret converging towards zero.
3. **Relative Performance:** In the simpler Bernoulli bandit task, standard `TS` (green) appears to have a slight edge in final performance. In the more complex shortest path task, `bootstrap TS` (purple) shows a clear lag in learning speed during the early phase but ultimately catches up.
4. **Noise:** The `bootstrap TS` line appears visually noisier (more high-frequency variation) than the other methods in both charts, particularly in chart (a).
### Interpretation
The data demonstrates the effectiveness of various Thompson Sampling approximations for sequential decision-making problems. The core finding is that all tested variants—Laplace, Langevin, bootstrap, and the standard version—successfully minimize regret over time, validating the general TS approach.
The difference in y-axis scales between the two plots is a critical piece of information. It suggests that the "online shortest path" environment presents a much harder exploration-exploitation dilemma, leading to higher initial regret. The fact that `bootstrap TS` lags in this harder task (chart b) could indicate that its resampling-based approximation is less efficient at initial exploration compared to the gradient-based (Langevin) or analytic (Laplace) approximations when the state-action space is larger or more complex. However, its eventual convergence shows it is still a viable method.
The charts are designed for direct comparison. By placing them side-by-side with identical legends and line colors, the author enables the viewer to easily track the relative performance of each algorithm across different problem domains. The primary takeaway is not a single "best" algorithm, but a demonstration of the robustness and comparative behavior of the TS family of algorithms. The slight performance edge of standard `TS` in the bandit task might be due to its exactness in that simple setting, while the approximations introduce minor overhead or bias.