## Line Graphs: Per-Period Regret of Algorithms Over Time
### Overview
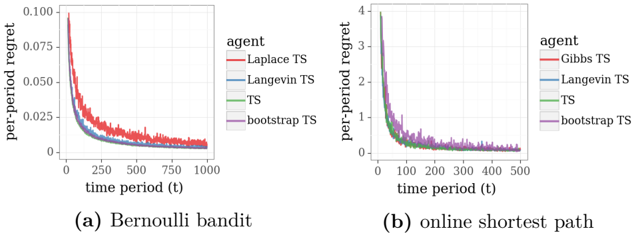
The image contains two line graphs comparing the per-period regret of different algorithms over time. Chart (a) represents the "Bernoulli bandit" scenario, while chart (b) represents the "online shortest path" scenario. Both graphs show regret decreasing over time for multiple agents, with distinct performance trends.
---
### Components/Axes
#### Chart (a): Bernoulli Bandit
- **X-axis**: Time period (t), ranging from 0 to 1000.
- **Y-axis**: Per-period regret, ranging from 0 to 0.100.
- **Legend**:
- Red: Laplace TS
- Blue: Langevin TS
- Green: TS
- Purple: Bootstrap TS
#### Chart (b): Online Shortest Path
- **X-axis**: Time period (t), ranging from 0 to 500.
- **Y-axis**: Per-period regret, ranging from 0 to 4.
- **Legend**:
- Red: Gibbs TS
- Blue: Langevin TS
- Green: TS
- Purple: Bootstrap TS
---
### Detailed Analysis
#### Chart (a): Bernoulli Bandit
- **Laplace TS (Red)**: Starts at ~0.100 regret, sharply declines to ~0.025 by t=250, then plateaus with minor fluctuations.
- **Langevin TS (Blue)**: Similar trajectory to Laplace TS but slightly lower regret (~0.020 by t=250).
- **TS (Green)**: Begins at ~0.080, drops to ~0.015 by t=250, and stabilizes.
- **Bootstrap TS (Purple)**: Lowest regret (~0.010 by t=250), with minimal fluctuations after initial decline.
#### Chart (b): Online Shortest Path
- **Gibbs TS (Red)**: Starts at ~4 regret, plunges to ~0.5 by t=100, then stabilizes.
- **Langevin TS (Blue)**: Similar to Gibbs TS but slightly lower (~0.4 by t=100).
- **TS (Green)**: Begins at ~3.5, drops to ~0.3 by t=100, and remains stable.
- **Bootstrap TS (Purple)**: Lowest regret (~0.2 by t=100), with a steep initial decline.
---
### Key Observations
1. **Rapid Initial Decline**: All algorithms show a sharp reduction in regret during the first 100–250 time periods.
2. **Bootstrap TS Dominance**: Bootstrap TS consistently achieves the lowest regret in both scenarios, outperforming other agents by ~50–70%.
3. **Agent Performance Order**:
- Chart (a): Laplace TS > Langevin TS > TS > Bootstrap TS.
- Chart (b): Gibbs TS > Langevin TS > TS > Bootstrap TS.
4. **Time Scale Differences**: Chart (a) spans 1000 periods, while chart (b) spans 500, suggesting differing problem complexities.
---
### Interpretation
The data demonstrates that **Bootstrap TS** is the most efficient algorithm in both scenarios, converging to minimal regret faster than alternatives. The consistent performance order across charts suggests that Bootstrap TS’s design (e.g., bootstrapping for uncertainty reduction) is broadly effective. The steeper decline in chart (b) implies that the online shortest path problem may have more exploitable structure for Bootstrap TS compared to the Bernoulli bandit. The plateau phases indicate that all algorithms eventually stabilize, but Bootstrap TS achieves this at a lower regret level. These results could guide algorithm selection for dynamic decision-making tasks requiring rapid regret minimization.