## Diagram: State Transition Diagram
### Overview
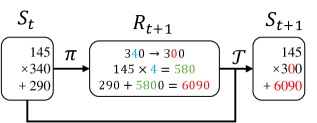
The image is a state transition diagram illustrating a process that transforms an initial state *S<sub>t</sub>* to a subsequent state *S<sub>t+1</sub>* via an intermediate reward *R<sub>t+1</sub>*. The diagram shows calculations performed at each stage.
### Components/Axes
* **Nodes:** Three rounded rectangles representing states and rewards.
* *S<sub>t</sub>*: Initial state.
* *R<sub>t+1</sub>*: Reward at time t+1.
* *S<sub>t+1</sub>*: Subsequent state.
* **Edges:** Arrows indicating transitions between states and rewards.
* Arrow from *S<sub>t</sub>* to *R<sub>t+1</sub>* labeled with "π".
* Arrow from *R<sub>t+1</sub>* to *S<sub>t+1</sub>* labeled with "T".
* Arrow from *S<sub>t+1</sub>* back to *S<sub>t</sub>*, forming a loop.
### Detailed Analysis or Content Details
* **Initial State (S<sub>t</sub>):**
* Value: 145
* Operation: multiplied by 340
* Operation: plus 290
* **Transition (π):**
* Arrow from *S<sub>t</sub>* to *R<sub>t+1</sub>*.
* **Reward (R<sub>t+1</sub>):**
* 340 (blue) -> 300 (red)
* 145 (blue) x 4 (cyan) = 580 (green)
* 290 (black) + 5800 (green) = 6090 (red)
* **Transition (T):**
* Arrow from *R<sub>t+1</sub>* to *S<sub>t+1</sub>*.
* **Subsequent State (S<sub>t+1</sub>):**
* Value: 145
* Operation: multiplied by 300
* Operation: plus 6090 (red)
* **Loop:**
* Arrow from *S<sub>t+1</sub>* back to *S<sub>t</sub>*.
### Key Observations
* The diagram illustrates a cyclical process.
* Calculations are performed at each state and reward stage.
* The reward *R<sub>t+1</sub>* involves multiple calculations, including a change from 340 to 300, multiplication, and addition.
* The final state *S<sub>t+1</sub>* uses the result from the reward calculation.
### Interpretation
The diagram represents a simplified model of a state transition process, possibly within a reinforcement learning context. The initial state *S<sub>t</sub>* is transformed based on a policy (π) to generate a reward *R<sub>t+1</sub>*. This reward, along with a transition function (T), determines the next state *S<sub>t+1</sub>*. The loop suggests that this process is iterative, with the subsequent state feeding back into the initial state for the next iteration. The calculations within each state and reward stage provide specific details on how the values are updated during the transition. The color coding in the reward stage highlights the transformation of values during the process.