\n
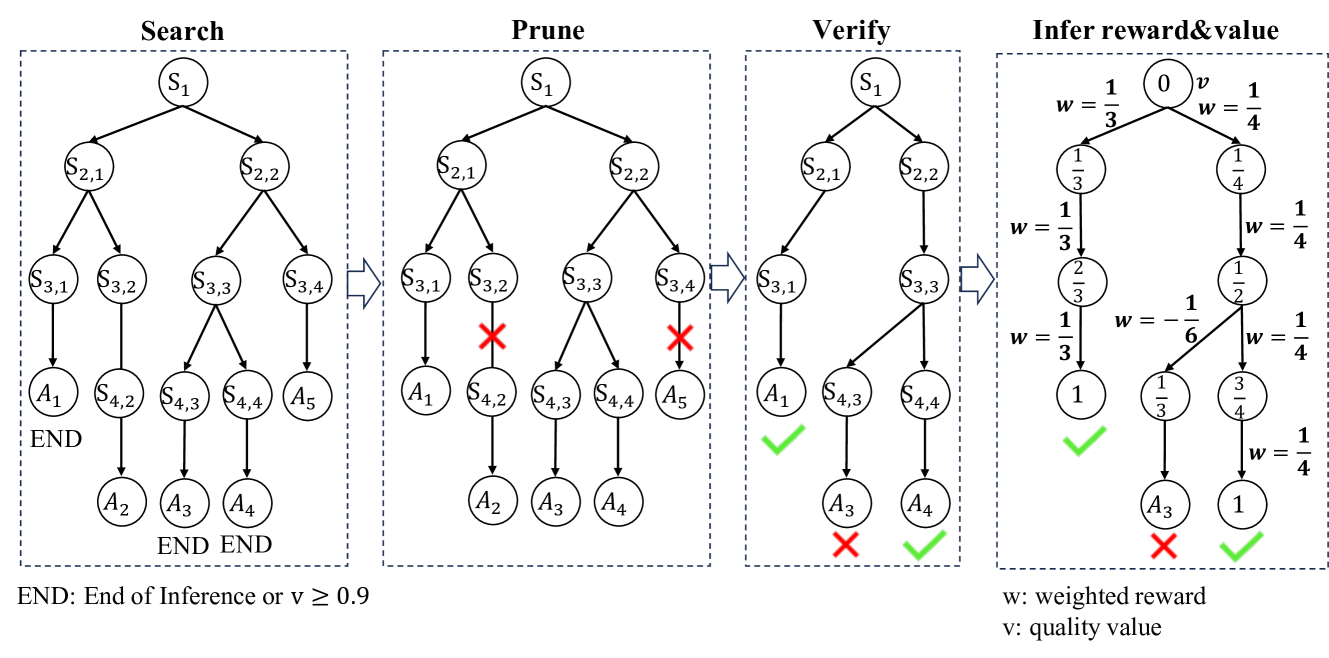
## Diagram: Monte Carlo Tree Search Process
### Overview
The image depicts a four-panel diagram illustrating the steps of a Monte Carlo Tree Search (MCTS) algorithm: Search, Prune, Verify, and Infer reward & value. Each panel shows a tree-like structure representing the search space, with nodes representing states and edges representing actions. The diagram visually demonstrates how the search space is explored, reduced, and evaluated to determine the optimal action.
### Components/Axes
The diagram consists of four distinct panels, each with a title indicating the MCTS stage. Each panel contains a tree-like diagram with nodes labeled as S<sub>i,j</sub> or A<sub>i</sub>. Arrows indicate the direction of search or pruning. Green checkmarks indicate successful paths, while red 'X' marks indicate pruned or rejected paths. The final panel includes equations for weighted reward (w) and quality value (v). A legend at the bottom defines "END: End of Inference or v ≥ 0.9", "w: weighted reward", and "v: quality value".
### Detailed Analysis or Content Details
**Panel 1: Search**
* The tree starts with a root node labeled S<sub>1</sub>.
* From S<sub>1</sub>, two branches lead to nodes S<sub>2,1</sub> and S<sub>2,2</sub>.
* From S<sub>2,1</sub>, two branches lead to nodes S<sub>3,1</sub> and S<sub>3,2</sub>.
* From S<sub>2,2</sub>, two branches lead to nodes S<sub>3,3</sub> and S<sub>3,4</sub>.
* From S<sub>3,1</sub>, a branch leads to A<sub>1</sub>, labeled "END".
* From S<sub>3,2</sub>, a branch leads to A<sub>2</sub>.
* From S<sub>3,3</sub>, a branch leads to A<sub>3</sub>.
* From S<sub>3,4</sub>, a branch leads to A<sub>4</sub>.
* From A<sub>2</sub>, A<sub>3</sub>, and A<sub>4</sub>, the diagram indicates "END END".
* All paths are followed with grey arrows.
**Panel 2: Prune**
* The tree structure is identical to the "Search" panel up to S<sub>3,4</sub>.
* The branch from S<sub>3,3</sub> to A<sub>3</sub> is marked with a red 'X', indicating pruning.
* The branch from S<sub>3,4</sub> to A<sub>5</sub> is marked with a red 'X', indicating pruning.
* Only the paths to A<sub>2</sub> and A<sub>4</sub> remain.
**Panel 3: Verify**
* The tree structure is similar to the "Search" panel.
* The branch from S<sub>3,1</sub> to A<sub>1</sub> is marked with a green checkmark.
* The branch from S<sub>3,2</sub> to A<sub>3</sub> is marked with a red 'X', indicating rejection.
* The branch from S<sub>3,4</sub> to A<sub>4</sub> is marked with a green checkmark.
* Only the paths to A<sub>1</sub> and A<sub>4</sub> are verified.
**Panel 4: Infer reward & value**
* This panel shows a series of interconnected circles representing the calculation of weighted reward (w) and quality value (v).
* From a central node, branches lead to nodes with values: 1/3, 1/4; 1/3, 1/2; 1/3, 1/6; 1/3, 1/4.
* The corresponding weighted rewards (w) and quality values (v) are displayed next to each node.
* The final node has a value of 1, and is marked with a red 'X'.
* The equations provided are: w = weighted reward, v = quality value.
### Key Observations
* The search space is progressively reduced through pruning and verification.
* The "Prune" step eliminates branches deemed less promising.
* The "Verify" step confirms the validity of certain paths.
* The final panel demonstrates the calculation of reward and value based on the explored paths.
* The red 'X' symbols consistently indicate rejection or pruning of paths.
* The green checkmarks consistently indicate acceptance or verification of paths.
### Interpretation
The diagram illustrates the core process of Monte Carlo Tree Search. The algorithm begins by exploring a search space (Search), then strategically reduces this space by eliminating less promising options (Prune). The remaining paths are then evaluated (Verify) to determine their quality and reward. The final step (Infer reward & value) involves calculating the weighted reward and quality value of the chosen path. The use of checkmarks and 'X' symbols provides a clear visual representation of the decision-making process. The equations for 'w' and 'v' suggest a probabilistic or statistical approach to evaluating the quality of different actions. The "END" condition (v ≥ 0.9) indicates a threshold for accepting a solution. The diagram effectively conveys the iterative and selective nature of MCTS, highlighting its ability to efficiently navigate complex search spaces.