## Flowchart Diagram: Decision-Making Process with Pruning and Verification
### Overview
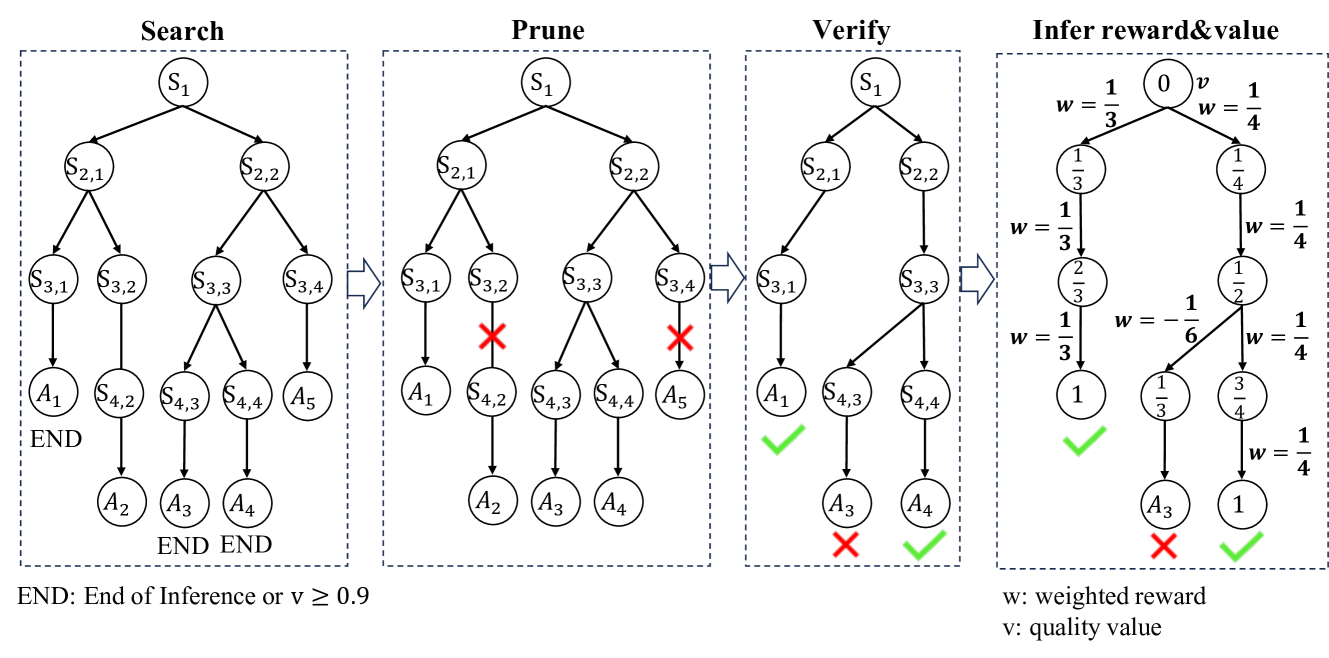
The diagram illustrates a multi-stage decision-making process involving **Search**, **Prune**, **Verify**, and **Infer reward&value** phases. It uses nodes, arrows, and symbolic annotations (red X, green checkmarks) to represent decision paths, pruning criteria, verification outcomes, and quantitative evaluations. The final stage assigns **weighted rewards (w)** and **quality values (v)** to terminal nodes.
---
### Components/Axes
1. **Nodes**:
- Labeled hierarchically (e.g., `S1`, `S2.1`, `S3.3`).
- Terminal nodes (`A1`, `A2`, `A3`, `A4`, `A5`) represent end states.
2. **Arrows**:
- Indicate flow between decision stages and sub-stages.
3. **Annotations**:
- **END**: Marked at terminal nodes with the condition `v ≥ 0.9` or "End of Inference."
- **Red X**: Indicates pruned or invalid paths (e.g., `S3.2`, `S3.4` in Prune stage).
- **Green Checkmarks**: Denote verified valid paths (e.g., `A3`, `A4` in Verify stage).
4. **Final Stage Metrics**:
- **Weighted Reward (w)**: Fractions (e.g., `w = 1/3`, `w = 1/4`).
- **Quality Value (v)**: Numerical values (e.g., `v = 1`, `v = 0`).
---
### Detailed Analysis
#### Search Stage
- Root node `S1` branches into `S2.1` and `S2.2`.
- Sub-nodes (`S3.1`, `S3.2`, `S3.3`, `S3.4`) further split into terminal nodes (`A1`-`A5`).
- All terminal nodes labeled `END` with `v ≥ 0.9`.
#### Prune Stage
- Nodes `S3.2` and `S3.4` are marked with **red X**, indicating removal from consideration.
- Remaining nodes (`S3.1`, `S3.3`, `S4.2`, `S4.3`, `S4.4`) retain connections to terminal nodes.
#### Verify Stage
- Terminal nodes `A1`, `A3`, and `A4` receive **green checkmarks**, signifying validation.
- `A2` and `A5` are marked with **red X**, indicating rejection.
#### Infer Reward&Value Stage
- Terminal nodes are assigned **weighted rewards (w)** and **quality values (v)**:
- `A1`: `w = 1/3`, `v = 1`
- `A2`: `w = 1/3`, `v = 0`
- `A3`: `w = 1/4`, `v = 1`
- `A4`: `w = 1/4`, `v = 1`
- `A5`: `w = 1/4`, `v = 0`
---
### Key Observations
1. **Pruning Efficiency**: 2/5 terminal nodes (`A2`, `A5`) are pruned in the Prune stage, reducing complexity.
2. **Verification Bias**: Validated nodes (`A3`, `A4`) receive higher quality values (`v = 1`) compared to rejected nodes (`v = 0`).
3. **Reward Distribution**: Weighted rewards (`w`) are inversely proportional to node depth (e.g., `A1` and `A2` at depth 3 receive `w = 1/3`, while `A3` and `A4` at depth 4 receive `w = 1/4`).
---
### Interpretation
The diagram represents a **hierarchical decision tree** with iterative refinement:
1. **Search** explores all possible paths.
2. **Prune** eliminates low-confidence branches (e.g., `S3.2`, `S3.4`).
3. **Verify** filters validated paths (`A3`, `A4`), discarding others (`A2`, `A5`).
4. **Infer** quantifies outcomes using **weighted rewards** (prioritizing shorter paths) and **quality values** (binary pass/fail).
**Notable Patterns**:
- Deeper nodes (e.g., `A3`, `A4`) have lower rewards but higher validation rates.
- The system favors shorter, validated paths (`A3`, `A4`) over longer or rejected ones (`A2`, `A5`).
**Implications**:
- The process balances exploration (Search) with exploitation (Prune/Verify) to optimize decision quality.
- Weighted rewards (`w`) and quality values (`v`) suggest a trade-off between path efficiency and reliability.