## Charts: Model Adaptation Learning (MAML) Performance
### Overview
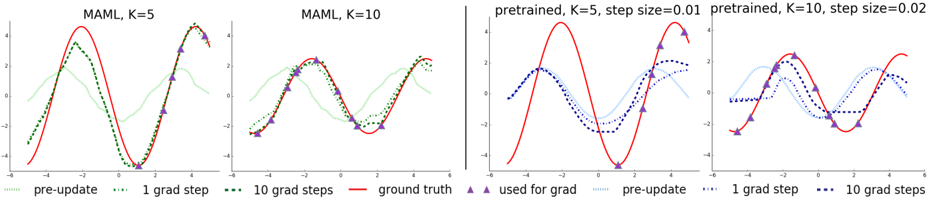
The image presents four line charts comparing the performance of different model adaptation strategies. The charts visualize the model's output (y-axis, ranging approximately from -5 to 5) against an unspecified input variable (x-axis, ranging approximately from -3 to 3). Each chart represents a different configuration of the MAML algorithm or a pre-trained model, with varying numbers of gradient steps (K) and step sizes. The charts compare "pre-update" values, values after "1 grad step", and values after "10 grad steps" against a "ground truth" baseline.
### Components/Axes
* **X-axis:** Unlabeled, representing the input variable. Scale ranges approximately from -3 to 3.
* **Y-axis:** Unlabeled, representing the model output. Scale ranges approximately from -5 to 5.
* **Chart 1 Title:** "MAML, K=5"
* **Chart 2 Title:** "MAML, K=10"
* **Chart 3 Title:** "pretrained, K=5, step size=0.01"
* **Chart 4 Title:** "pretrained, K=10, step size=0.02"
* **Legend (shared across all charts, positioned at the bottom):**
* `--` (green): "pre-update"
* `..` (blue): "1 grad step"
* `...` (purple): "10 grad steps"
* `-` (red): "ground truth"
* `^` (dark red): "used for grad"
### Detailed Analysis or Content Details
**Chart 1: MAML, K=5**
* **Ground Truth (red solid line):** A sinusoidal wave with a period of approximately 2, peaking around x=0 and bottoming around x=-3 and x=3. Values range from approximately -4.5 to 4.5.
* **Pre-update (green dashed line):** Starts around y=-2 at x=-3, rises to approximately y=1 at x=0, and falls back to approximately y=-2 at x=3.
* **1 grad step (blue dotted line):** Starts around y=-1.5 at x=-3, rises to approximately y=3 at x=0, and falls back to approximately y=-1.5 at x=3.
* **10 grad steps (purple dotted line):** Starts around y=-2.5 at x=-3, rises to approximately y=3.5 at x=0, and falls back to approximately y=-2.5 at x=3.
**Chart 2: MAML, K=10**
* **Ground Truth (red solid line):** Identical to Chart 1.
* **Pre-update (green dashed line):** Similar to Chart 1, but with slightly more variation. Starts around y=-2.5 at x=-3, rises to approximately y=0.5 at x=0, and falls back to approximately y=-2.5 at x=3.
* **1 grad step (blue dotted line):** Starts around y=-2 at x=-3, rises to approximately y=2.5 at x=0, and falls back to approximately y=-2 at x=3.
* **10 grad steps (purple dotted line):** Starts around y=-3 at x=-3, rises to approximately y=4 at x=0, and falls back to approximately y=-3 at x=3.
**Chart 3: pretrained, K=5, step size=0.01**
* **Ground Truth (red solid line):** Identical to Chart 1.
* **Pre-update (green dashed line):** Starts around y=-3 at x=-3, rises to approximately y=4 at x=0, and falls back to approximately y=-3 at x=3.
* **1 grad step (blue dotted line):** Starts around y=-2 at x=-3, rises to approximately y=3 at x=0, and falls back to approximately y=-2 at x=3.
* **10 grad steps (purple dotted line):** Starts around y=-2.5 at x=-3, rises to approximately y=2.5 at x=0, and falls back to approximately y=-2.5 at x=3.
**Chart 4: pretrained, K=10, step size=0.02**
* **Ground Truth (red solid line):** Identical to Chart 1.
* **Pre-update (green dashed line):** Starts around y=-3.5 at x=-3, rises to approximately y=4.5 at x=0, and falls back to approximately y=-3.5 at x=3.
* **1 grad step (blue dotted line):** Starts around y=-2.5 at x=-3, rises to approximately y=3.5 at x=0, and falls back to approximately y=-2.5 at x=3.
* **10 grad steps (purple dotted line):** Starts around y=-3 at x=-3, rises to approximately y=3 at x=0, and falls back to approximately y=-3 at x=3.
### Key Observations
* In all charts, the "ground truth" (red line) provides a consistent baseline.
* The "pre-update" (green line) consistently deviates from the "ground truth," indicating an initial mismatch between the model's prediction and the target.
* Applying gradient steps (blue and purple lines) generally moves the model's prediction closer to the "ground truth," suggesting that the adaptation process is effective.
* Increasing the number of gradient steps (from blue to purple) often leads to further improvement, but can also result in overshooting or oscillations.
* The pre-trained models (Charts 3 & 4) start with a larger deviation from the ground truth than the MAML models (Charts 1 & 2).
* The step size parameter (0.01 vs 0.02) in the pre-trained models appears to influence the adaptation speed and stability.
### Interpretation
These charts demonstrate the effectiveness of MAML and pre-training for rapid adaptation to new tasks. The "ground truth" likely represents the desired output for a given input, and the other lines show how the model's prediction evolves as it learns. The MAML approach (Charts 1 & 2) appears to initialize the model closer to the optimal solution, requiring fewer gradient steps to achieve good performance. The pre-trained models (Charts 3 & 4) require more adaptation but can still converge to a reasonable solution. The choice of step size is crucial for pre-trained models, as a larger step size can lead to instability or overshooting. The "used for grad" markers (dark red triangles) are not consistently placed and their purpose is unclear without additional context, but they likely indicate the points used for calculating the gradient. The charts suggest that MAML is a more efficient adaptation strategy, particularly when the number of gradient steps is limited. The data suggests that the model is learning to approximate the underlying function represented by the "ground truth" signal.