TECHNICAL ASSET FINGERPRINT
c21923bad76cd47fd3d46251
Click to view fullscreen
Press ESC or click to close
FOUND IN PAPERS
EXPERT: healer-alpha-free VERSION 1
RUNTIME: free/openrouter/healer-alpha
INTEL_VERIFIED
## Line Graphs: MAML vs. Pretrained Model Adaptation
### Overview
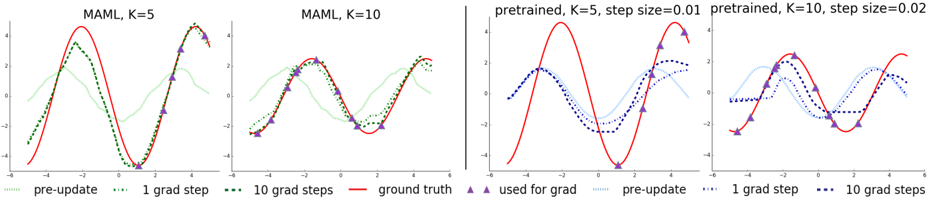
The image displays four horizontally arranged line graphs comparing the performance of two types of machine learning models—MAML (Model-Agnostic Meta-Learning) and a pretrained model—in fitting a sinusoidal ground truth function. Each graph shows the model's prediction at different stages of adaptation (pre-update, after 1 gradient step, after 10 gradient steps) against the true function and the data points used for adaptation.
### Components/Axes
* **Chart Type:** Four separate line graphs in a 1x4 horizontal layout.
* **X-Axis:** Common to all graphs. Linear scale ranging from **-6 to 6**, with major tick marks at intervals of 2 (-6, -4, -2, 0, 2, 4, 6). No explicit axis label is present.
* **Y-Axis:** Common to all graphs. Linear scale ranging from **-4 to 4**, with major tick marks at intervals of 2 (-4, -2, 0, 2, 4). No explicit axis label is present.
* **Legend:** Positioned at the bottom center of the entire image, spanning all four graphs. It defines the following visual encodings:
* **Line Styles & Colors:**
* `pre-update`: Light green, dotted line (`...`).
* `1 grad step`: Dark green, dotted line (`...`).
* `10 grad steps`: Dark green, dashed line (`--`).
* `ground truth`: Solid red line.
* `pre-update` (for pretrained): Light blue, dotted line (`...`).
* `1 grad step` (for pretrained): Dark blue, dotted line (`...`).
* `10 grad steps` (for pretrained): Dark blue, dashed line (`--`).
* **Markers:**
* `used for grad`: Purple upward-pointing triangles.
* **Graph Titles (Top of each subplot):**
1. `MAML, K=5`
2. `MAML, K=10`
3. `pretrained, K=5, step size=0.01`
4. `pretrained, K=10, step size=0.02`
### Detailed Analysis
**Graph 1: MAML, K=5**
* **Ground Truth (Red Line):** A smooth sine wave with peaks near y=4 at x≈-3 and x≈3, and a trough near y=-4 at x≈0.
* **Data Points (Purple Triangles):** 5 points are scattered along the ground truth curve, approximately at x = -4.5, -2.5, -0.5, 1.5, 3.5.
* **Model Progression:**
* **Pre-update (Light Green Dotted):** A low-amplitude, poorly fitted wave, roughly in phase but with much smaller peaks/troughs.
* **1 Grad Step (Dark Green Dotted):** Significantly closer to the ground truth, capturing the general shape but with slightly underestimated amplitude.
* **10 Grad Steps (Dark Green Dashed):** Very closely matches the ground truth red line, almost overlapping it entirely.
**Graph 2: MAML, K=10**
* **Ground Truth (Red Line):** Identical sine wave as in Graph 1.
* **Data Points (Purple Triangles):** 10 points densely sampled along the ground truth curve across the entire x-range.
* **Model Progression:**
* **Pre-update (Light Green Dotted):** Similar poor initial fit as in the K=5 case.
* **1 Grad Step (Dark Green Dotted):** Already a very good fit, closely tracking the ground truth.
* **10 Grad Steps (Dark Green Dashed):** Nearly perfect overlap with the ground truth, indicating rapid and accurate adaptation with more data points (K=10).
**Graph 3: Pretrained, K=5, step size=0.01**
* **Ground Truth (Red Line):** Identical sine wave.
* **Data Points (Purple Triangles):** Same 5 points as in Graph 1.
* **Model Progression:**
* **Pre-update (Light Blue Dotted):** A wave that is roughly in phase but has a significantly lower amplitude than the ground truth.
* **1 Grad Step (Dark Blue Dotted):** Shows improvement, moving closer to the ground truth, but the fit is noticeably worse than MAML's 1-step result for K=5.
* **10 Grad Steps (Dark Blue Dashed):** Has moved much closer to the ground truth but still shows a visible gap, particularly underestimating the peak amplitudes. It does not achieve the tight fit seen with MAML.
**Graph 4: Pretrained, K=10, step size=0.02**
* **Ground Truth (Red Line):** Identical sine wave.
* **Data Points (Purple Triangles):** Same 10 points as in Graph 2.
* **Model Progression:**
* **Pre-update (Light Blue Dotted):** Similar poor initial fit as in the K=5 pretrained case.
* **1 Grad Step (Dark Blue Dotted):** A better fit than the 1-step result for K=5, but still not as good as MAML's 1-step result for K=10.
* **10 Grad Steps (Dark Blue Dashed):** A good fit that closely follows the ground truth, but upon close inspection, it may be slightly less accurate than the MAML K=10 result after 10 steps. The larger step size (0.02 vs 0.01) likely contributes to the faster adaptation here.
### Key Observations
1. **MAML vs. Pretrained Adaptation Speed:** MAML (green lines) consistently adapts to the ground truth faster and more accurately than the pretrained model (blue lines) for the same number of gradient steps and data points (K). This is most evident after just 1 gradient step.
2. **Effect of Data Points (K):** For both model types, increasing K from 5 to 10 dramatically improves the quality of adaptation after 1 and 10 steps. The K=10 models achieve near-perfect fits much more readily.
3. **Pre-update State:** All models start from a poor, low-amplitude approximation of the function before any task-specific adaptation.
4. **Convergence:** MAML with K=10 shows the most rapid and precise convergence, with the 1-step and 10-step lines being nearly indistinguishable from the ground truth.
### Interpretation
This visualization demonstrates the core advantage of meta-learning algorithms like MAML. The "pre-update" line represents the model's generic, meta-learned prior. The subsequent lines show how quickly this prior can be adapted to a specific new task (fitting this particular sine wave) using a small amount of task-specific data (the purple triangles).
The data suggests that MAML learns an initialization that is exceptionally sensitive and responsive to gradient-based adaptation. It requires fewer steps and less data to achieve high accuracy compared to a standard pretrained model, which likely has a less adaptable initial state. The comparison between K=5 and K=10 highlights the fundamental trade-off in few-shot learning: more examples per task (higher K) lead to better and faster adaptation. The pretrained model's need for a larger step size (0.02 vs 0.01) to achieve reasonable adaptation with K=10 further indicates its less optimal starting point for this specific task. In essence, the image provides visual evidence for the "learning to learn" capability of meta-learning systems.
DECODING INTELLIGENCE...