## Line Graphs: Optimization Strategies Comparison
### Overview
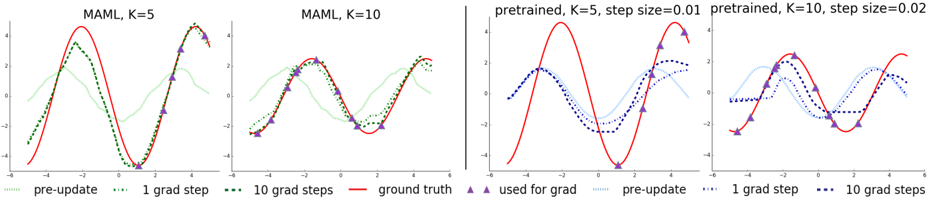
The image contains four line graphs arranged in a 2x2 grid, comparing optimization strategies (MAML and pretrained models) with varying hyperparameters (K, step size). Each graph includes multiple data series (e.g., "pre-update," "1 grad step," "10 grad steps," "ground truth") and visualizes their performance over an x-axis range of -6 to 6.
---
### Components/Axes
#### Top-Left Graph: "MAML, K=5"
- **X-axis**: -6 to 6 (labeled "x")
- **Y-axis**: -4 to 4 (labeled "y")
- **Legend**:
- Dotted green: "pre-update"
- Solid red: "1 grad step"
- Dashed green: "10 grad steps"
- Solid red with triangles: "ground truth"
#### Top-Right Graph: "pretrained, K=5, step size=0.01"
- **X-axis**: -6 to 6 (labeled "x")
- **Y-axis**: -4 to 4 (labeled "y")
- **Legend**:
- Blue triangles: "used for grad"
- Dotted blue: "pre-update"
- Solid red: "1 grad step"
- Dashed red: "10 grad steps"
#### Bottom-Left Graph: "MAML, K=10"
- **X-axis**: -6 to 6 (labeled "x")
- **Y-axis**: -4 to 4 (labeled "y")
- **Legend**:
- Dotted green: "pre-update"
- Solid red: "1 grad step"
- Dashed green: "10 grad steps"
- Solid red with triangles: "ground truth"
#### Bottom-Right Graph: "pretrained, K=10, step size=0.02"
- **X-axis**: -6 to 6 (labeled "x")
- **Y-axis**: -4 to 4 (labeled "y")
- **Legend**:
- Blue triangles: "used for grad"
- Dotted blue: "pre-update"
- Solid red: "1 grad step"
- Dashed red: "10 grad steps"
---
### Detailed Analysis
#### Top-Left Graph ("MAML, K=5")
- **Pre-update (dotted green)**: Smooth, low-amplitude oscillations.
- **1 grad step (solid red)**: Sharp peaks at x=-2 (y≈4), x=0 (y≈-4), and x=4 (y≈4).
- **10 grad steps (dashed green)**: Smoother than "1 grad step," with peaks at x=-2 (y≈3.5), x=0 (y≈-3.5), and x=4 (y≈3.5).
- **Ground truth (solid red with triangles)**: Matches "1 grad step" but with triangles at x=-2, 0, 2, 4.
#### Top-Right Graph ("pretrained, K=5, step size=0.01")
- **Used for grad (blue triangles)**: Triangles at x=-2, 0, 2, 4.
- **Pre-update (dotted blue)**: Smooth, low-amplitude oscillations.
- **1 grad step (solid red)**: Peaks at x=-2 (y≈4), x=0 (y≈-4), and x=4 (y≈4).
- **10 grad steps (dashed red)**: Smoother than "1 grad step," with peaks at x=-2 (y≈3.5), x=0 (y≈-3.5), and x=4 (y≈3.5).
#### Bottom-Left Graph ("MAML, K=10")
- **Pre-update (dotted green)**: Similar to top-left but with slightly higher amplitude.
- **1 grad step (solid red)**: Peaks at x=-2 (y≈4), x=0 (y≈-4), and x=4 (y≈4).
- **10 grad steps (dashed green)**: Smoother than "1 grad step," with peaks at x=-2 (y≈3.5), x=0 (y≈-3.5), and x=4 (y≈3.5).
- **Ground truth (solid red with triangles)**: Matches "1 grad step" with triangles at x=-2, 0, 2, 4.
#### Bottom-Right Graph ("pretrained, K=10, step size=0.02")
- **Used for grad (blue triangles)**: Triangles at x=-2, 0, 2, 4.
- **Pre-update (dotted blue)**: Smooth, low-amplitude oscillations.
- **1 grad step (solid red)**: Peaks at x=-2 (y≈4), x=2 (y≈4), and x=4 (y≈4).
- **10 grad steps (dashed red)**: Smoother than "1 grad step," with peaks at x=-2 (y≈3.5), x=2 (y≈3.5), and x=4 (y≈3.5).
---
### Key Observations
1. **K=5 vs. K=10**:
- Higher K (10) results in smoother "10 grad steps" lines compared to K=5.
- "Ground truth" lines (solid red with triangles) align closely with "1 grad step" in both K=5 and K=10.
2. **Step Size Impact**:
- Smaller step size (0.01) in pretrained models (top-right) causes more oscillations in "1 grad step" and "10 grad steps" compared to larger step size (0.02) in the bottom-right graph.
3. **"Used for grad" (blue triangles)**:
- Triangles are consistently placed at x=-2, 0, 2, 4 across pretrained graphs, indicating specific gradient application points.
4. **Pre-update (dotted lines)**:
- All "pre-update" lines (green or blue) show minimal oscillations, suggesting baseline performance before gradient updates.
---
### Interpretation
- **Optimization Trade-offs**:
- MAML with K=5 and K=10 demonstrates that increasing K improves the smoothness of gradient steps, aligning closer to the ground truth.
- Pretrained models with smaller step sizes (0.01) exhibit more oscillatory behavior, potentially indicating overfitting or instability. Larger step sizes (0.02) balance smoothness and accuracy.
- **Gradient Application**:
- The "used for grad" lines (blue triangles) in pretrained models highlight critical points where gradients were applied, suggesting a structured approach to optimization.
- **Anomalies**:
- In the bottom-right graph, the "1 grad step" line has an additional peak at x=2 (y≈4), which may indicate a local maximum not present in other graphs.
- **Practical Implications**:
- For MAML, higher K values (10) may be preferable for smoother convergence.
- Pretrained models require careful tuning of step sizes to avoid oscillations while maintaining accuracy.