## Bar Chart: BioLP-Bench Performance Comparison
### Overview
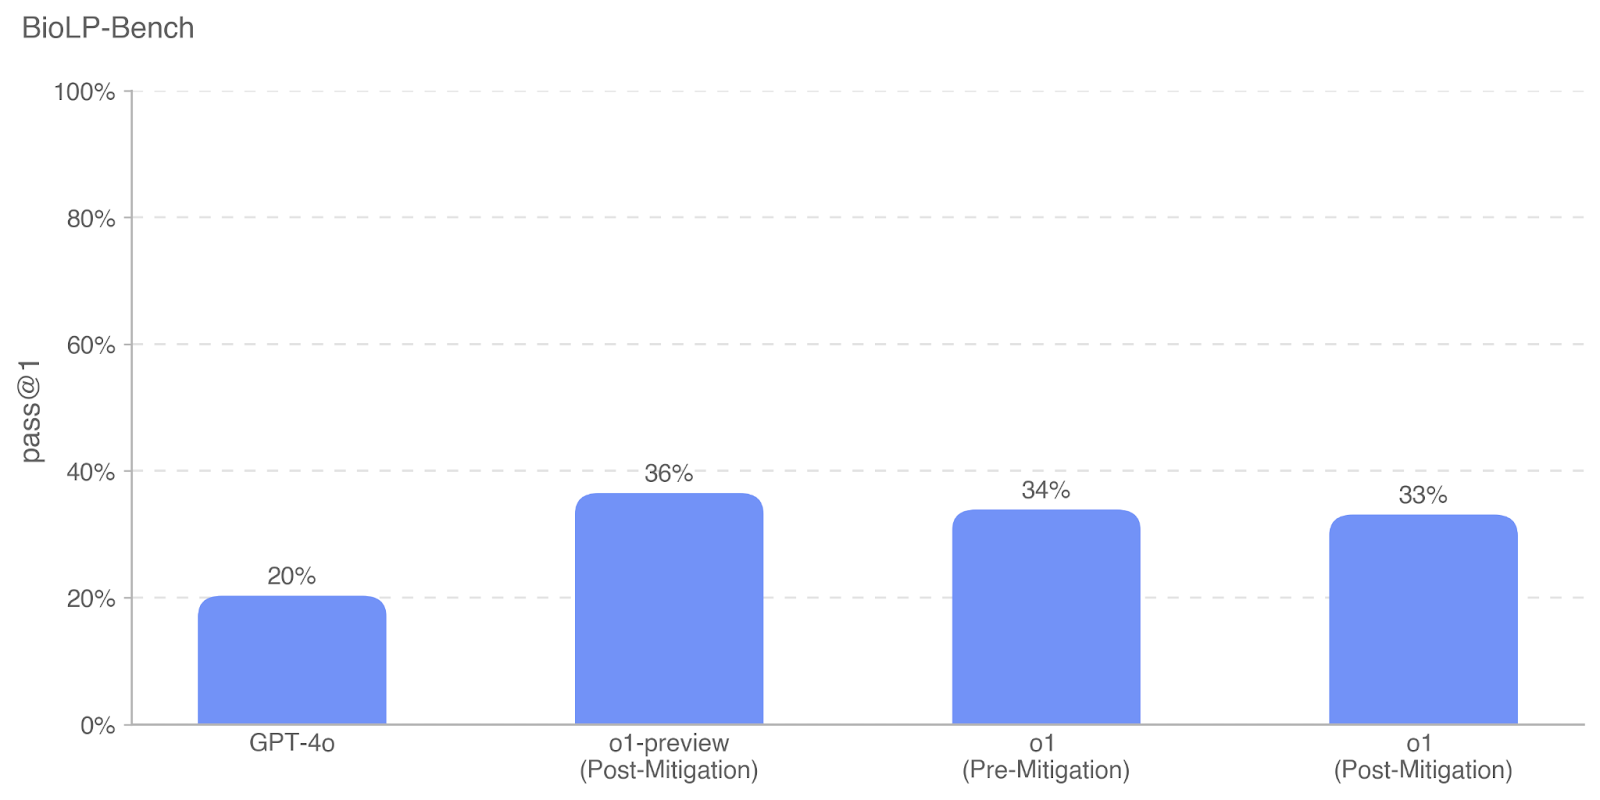
The chart compares the performance of four language models on the BioLP-Bench benchmark, measured by "pass@1" metric. Four categories are evaluated: GPT-4o, o1-preview (Post-Mitigation), o1 (Pre-Mitigation), and o1 (Post-Mitigation). Performance values are represented as percentages.
### Components/Axes
- **X-axis**: Model categories (GPT-4o, o1-preview [Post-Mitigation], o1 [Pre-Mitigation], o1 [Post-Mitigation])
- **Y-axis**: "pass@1" metric (0% to 100% scale)
- **Bars**: Blue-colored vertical bars with percentage labels on top
- **Title**: "BioLP-Bench" (top-left)
- **Legend**: Not visible in the image
### Detailed Analysis
1. **GPT-4o**: 20% pass@1 (lowest performance)
2. **o1-preview (Post-Mitigation)**: 36% pass@1 (highest performance)
3. **o1 (Pre-Mitigation)**: 34% pass@1
4. **o1 (Post-Mitigation)**: 33% pass@1
### Key Observations
- **Performance Gaps**:
- GPT-4o significantly underperforms compared to other models (20% vs. 33-36%).
- o1-preview (Post-Mitigation) achieves the highest score (36%), suggesting mitigation improved its performance.
- **o1 Model Trends**:
- Pre-Mitigation (34%) and Post-Mitigation (33%) show near-identical results, with a slight decline post-mitigation.
- **Mitigation Impact**:
- o1-preview shows a 16% improvement from pre-mitigation (34% → 36%), while o1 shows minimal change (34% → 33%).
### Interpretation
The data suggests that mitigation strategies significantly improved o1-preview's performance but had negligible impact on the o1 model. GPT-4o's lack of mitigation (or inherent limitations) results in the lowest score. The near-identical performance of o1 pre- and post-mitigation raises questions about the effectiveness of mitigation for this specific model. The "pass@1" metric likely reflects task-specific accuracy, with mitigation potentially addressing biases or errors in model outputs. The slight drop in o1's post-mitigation score warrants further investigation into whether mitigation introduced trade-offs in certain evaluation criteria.