## Bar Chart: BioLP-Bench Performance
### Overview
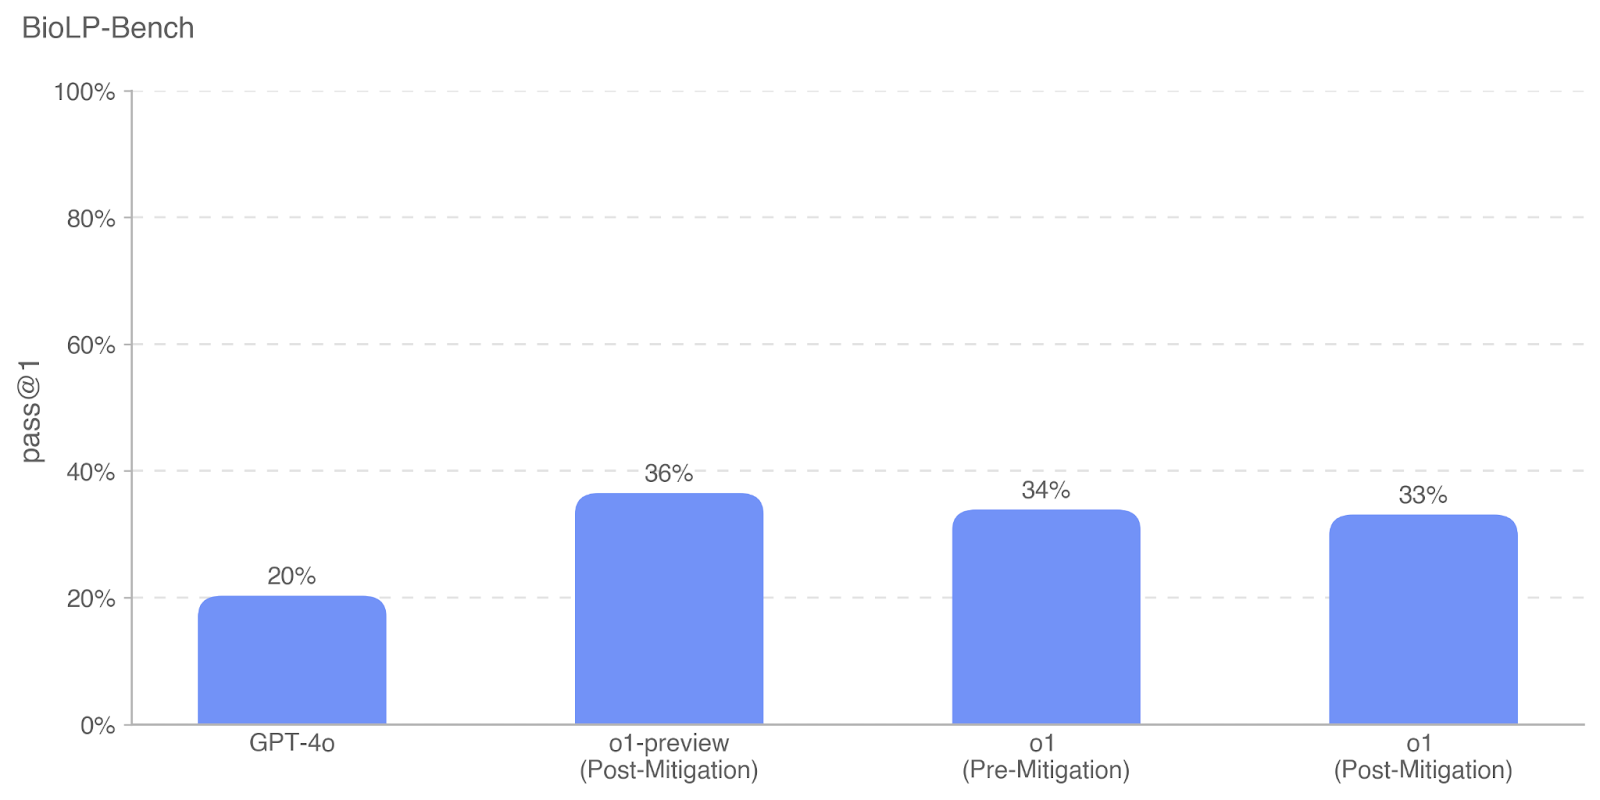
The image is a bar chart comparing the performance of different models on the BioLP-Bench benchmark, measured by the "pass@1" metric. The chart displays the performance of GPT-4o, o1-preview (Post-Mitigation), o1 (Pre-Mitigation), and o1 (Post-Mitigation). All bars are the same shade of blue.
### Components/Axes
* **Title:** BioLP-Bench
* **Y-axis:** "pass@1" with percentage values ranging from 0% to 100% in increments of 20%. Horizontal dashed lines mark each increment.
* **X-axis:** Categorical axis with the following categories:
* GPT-4o
* o1-preview (Post-Mitigation)
* o1 (Pre-Mitigation)
* o1 (Post-Mitigation)
### Detailed Analysis
* **GPT-4o:** The bar for GPT-4o reaches 20%.
* **o1-preview (Post-Mitigation):** The bar for o1-preview (Post-Mitigation) reaches 36%.
* **o1 (Pre-Mitigation):** The bar for o1 (Pre-Mitigation) reaches 34%.
* **o1 (Post-Mitigation):** The bar for o1 (Post-Mitigation) reaches 33%.
### Key Observations
* GPT-4o has the lowest pass@1 score at 20%.
* o1-preview (Post-Mitigation) has the highest pass@1 score at 36%.
* The "o1" model shows a slight decrease in performance after mitigation (34% pre-mitigation vs. 33% post-mitigation).
### Interpretation
The chart compares the performance of different models on the BioLP-Bench benchmark. The "o1-preview" model with post-mitigation shows the best performance, while GPT-4o performs the worst. The "o1" model shows a slight decrease in performance after mitigation. This suggests that the mitigation strategies applied to "o1" might have had a slightly negative impact on its performance, while the "o1-preview" model benefited from post-mitigation strategies. The difference between pre and post mitigation for "o1" is very small, suggesting the mitigation had little effect.