## Box Plots: Comparison of ξ and α Parameters
### Overview
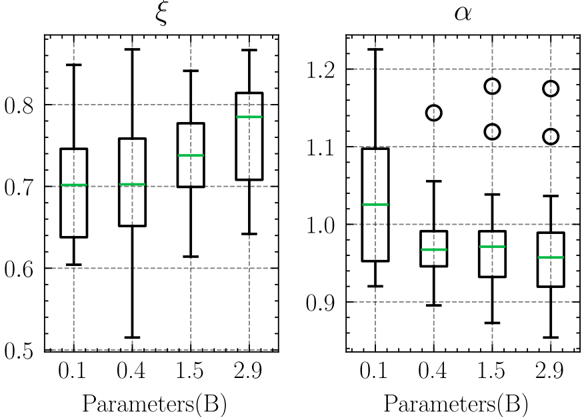
The image contains two side-by-side box plots comparing the distributions of two parameters, ξ (left) and α (right), across four parameter categories (B = 0.1, 0.4, 1.5, 2.9). Each plot includes medians (green lines), interquartile ranges (boxes), whiskers, and outliers (open circles). The y-axes represent normalized values, with ξ ranging from 0.5–0.8 and α from 0.9–1.2.
---
### Components/Axes
- **X-Axis (Parameters(B))**:
- Categories: 0.1, 0.4, 1.5, 2.9 (labeled as "Parameters(B)").
- **Y-Axis (ξ)**:
- Range: 0.5–0.8 (left plot).
- Median (green line) and quartiles (box edges) marked.
- **Y-Axis (α)**:
- Range: 0.9–1.2 (right plot).
- Median (green line) and quartiles (box edges) marked.
- **Outliers**:
- Open circles outside whiskers (1.5×IQR threshold).
- **Legend**:
- No explicit legend, but green lines represent medians.
---
### Detailed Analysis
#### ξ (Left Plot)
- **Median Trends**:
- Median increases from ~0.7 (B=0.1) to ~0.75 (B=2.9).
- **Spread**:
- IQR widens from B=0.1 to B=2.9.
- **Outliers**:
- B=0.1: Outlier at ~0.85 (above upper whisker).
- B=2.9: Outlier at ~0.9 (above upper whisker).
#### α (Right Plot)
- **Median Trends**:
- Median decreases from ~1.05 (B=0.1) to ~0.95 (B=2.9).
- **Spread**:
- IQR narrows from B=0.1 to B=2.9.
- **Outliers**:
- B=0.1: Outlier at ~1.15 (above upper whisker).
- B=0.4: Outlier at ~1.1 (above upper whisker).
- B=1.5 and B=2.9: Outliers at ~1.15 (above upper whisker).
---
### Key Observations
1. **ξ**:
- Central tendency increases with parameter B, but variability (IQR) also grows.
- Outliers at extremes (B=0.1 and B=2.9) suggest rare high-value deviations.
2. **α**:
- Central tendency decreases with parameter B, with tighter distributions at higher B.
- Multiple outliers across all B categories, indicating persistent anomalies.
---
### Interpretation
- **ξ vs. α Behavior**:
- ξ exhibits a positive correlation between parameter B and central tendency, while α shows a negative correlation. This suggests opposing relationships between the parameters and their distributions.
- **Outlier Patterns**:
- Outliers in ξ are limited to the smallest and largest B values, whereas α outliers are widespread, hinting at systemic instability in α across all B categories.
- **Practical Implications**:
- For ξ, increasing B may improve typical outcomes but introduces greater variability. For α, higher B stabilizes results but does not eliminate outliers, requiring further investigation into anomalous cases.
- **Data Limitations**:
- Small sample sizes (implied by box plot compactness) may affect reliability of trends.