## Line Chart: Additive WeakL vs Online WeakL
### Overview
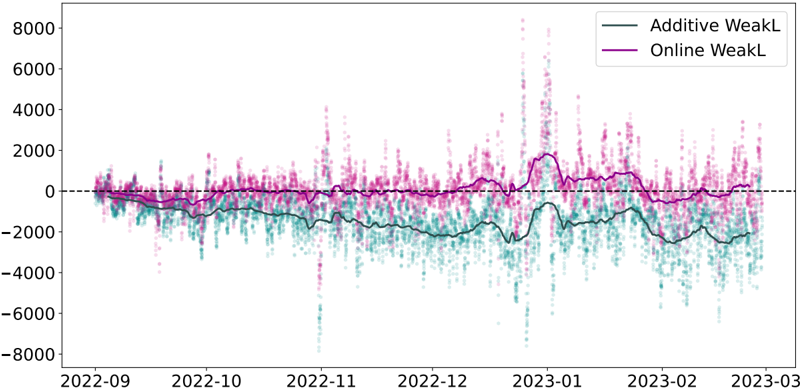
The image is a line chart comparing two data series: "Additive WeakL" and "Online WeakL" over time, from approximately September 2022 to March 2023. The chart displays the trends of these two series, with individual data points scattered around the smoothed lines.
### Components/Axes
* **X-axis (Horizontal):** Represents time, labeled with dates from "2022-09" to "2023-03". The dates are approximately monthly.
* **Y-axis (Vertical):** Represents a numerical value, ranging from -8000 to 8000, with increments of 2000.
* **Legend (Top-Right):**
* "Additive WeakL" - Represented by a dark green line.
* "Online WeakL" - Represented by a purple line.
* **Horizontal Dashed Line:** A dashed black line is present at y=0.
### Detailed Analysis
* **Additive WeakL (Dark Green):**
* **Trend:** The line starts near 0 in September 2022, then generally trends downward, reaching a minimum around -2500 in February 2023, before slightly increasing towards March 2023.
* **Data Points:**
* 2022-09: Approximately -500
* 2022-11: Approximately -1500
* 2023-01: Approximately -1800
* 2023-03: Approximately -2000
* **Online WeakL (Purple):**
* **Trend:** The line starts near 0 in September 2022, fluctuates around 0 until December 2022, then rises sharply to a peak around 2000 in January 2023, before decreasing and fluctuating around 0 again in February and March 2023.
* **Data Points:**
* 2022-09: Approximately -200
* 2022-11: Approximately -300
* 2023-01: Approximately 1800
* 2023-03: Approximately -200
### Key Observations
* The "Online WeakL" series shows a significant spike in January 2023, while the "Additive WeakL" series remains relatively stable and negative throughout the period.
* Both series start near 0, but "Additive WeakL" consistently underperforms "Online WeakL" except for the spike in January 2023.
* The scattered data points indicate the volatility of the underlying data, with the lines representing a smoothed average.
### Interpretation
The chart compares the performance of two different strategies, "Additive WeakL" and "Online WeakL", over time. The "Online WeakL" strategy appears to be more volatile, with a significant positive spike in January 2023, but otherwise performs similarly to "Additive WeakL". The "Additive WeakL" strategy shows a consistent negative trend, suggesting it may be underperforming compared to the "Online WeakL" strategy for most of the observed period. The dashed line at y=0 serves as a baseline, indicating periods of positive or negative performance for each strategy. The scattered data points around the lines suggest that there are daily fluctuations in the performance of both strategies, and the lines represent a smoothed average of these fluctuations.