## Line Chart: Additive vs. Online WeakL Over Time
### Overview
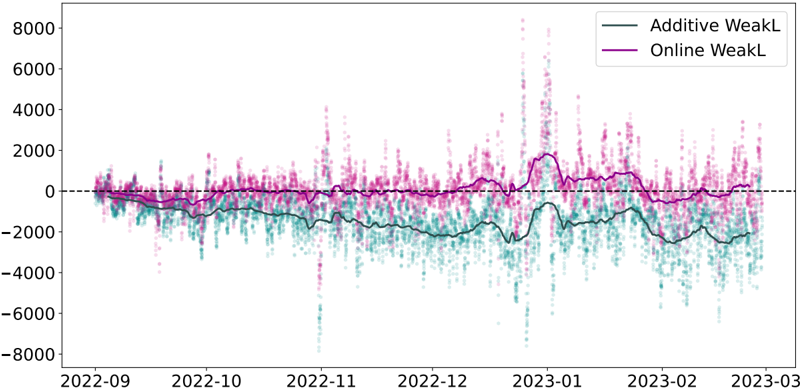
The chart displays two time-series data sets ("Additive WeakL" and "Online WeakL") plotted against a monthly timeline from September 2022 to March 2023. The y-axis represents numerical values ranging from -8000 to 8000, while the x-axis marks time in months. The chart includes a horizontal dashed line at y=0 for reference.
### Components/Axes
- **X-axis**: Time (months: 2022-09 to 2023-03), labeled with approximate dates.
- **Y-axis**: Numerical values (-8000 to 8000), no explicit title.
- **Legend**: Located in the top-right corner, with two entries:
- **Teal line**: "Additive WeakL"
- **Magenta line**: "Online WeakL"
- **Data Points**: Scattered dots (teal and magenta) represent individual measurements, with solid lines connecting them to show trends.
### Detailed Analysis
1. **Additive WeakL (Teal Line)**:
- **Trend**: Consistently negative, fluctuating between approximately -2000 and -4000.
- **Key Points**:
- A sharp dip to ~-6000 in December 2022.
- Gradual recovery to ~-2000 by March 2023.
- **Scatter Points**: Dense clustering around -3000 to -4000, with occasional outliers near -2000.
2. **Online WeakL (Magenta Line)**:
- **Trend**: Mostly positive, fluctuating between 0 and 2000.
- **Key Points**:
- A significant spike to ~4000 in January 2023.
- Stabilization near 0–1000 by March 2023.
- **Scatter Points**: High variability, with dense clusters near 0–1000 and sparse outliers up to 4000.
### Key Observations
- **Contrasting Trends**: Additive WeakL remains negative throughout, while Online WeakL is predominantly positive.
- **Outliers**:
- Additive WeakL: December 2022 dip (-6000) suggests a temporary anomaly.
- Online WeakL: January 2023 spike (4000) indicates a short-term surge.
- **Correlation**: No clear direct correlation between the two lines; their trends appear independent.
### Interpretation
The data suggests two distinct phenomena:
1. **Additive WeakL** may represent a cumulative deficit or loss (e.g., resource depletion, financial shortfall), with a notable but temporary exacerbation in December 2022.
2. **Online WeakL** could reflect gains or positive activity (e.g., user engagement, revenue), with a sharp but transient increase in January 2023. The lack of synchronization between the two lines implies they may stem from separate processes or external factors. The spike in Online WeakL might correlate with an external event (e.g., marketing campaign, system update), while the Additive WeakL dip could indicate operational challenges. Further investigation into contextual factors (e.g., seasonal trends, policy changes) is warranted to explain these patterns.