## Heatmap: Baseline - Long-to-Short - Qwen-2.5 3B
### Overview
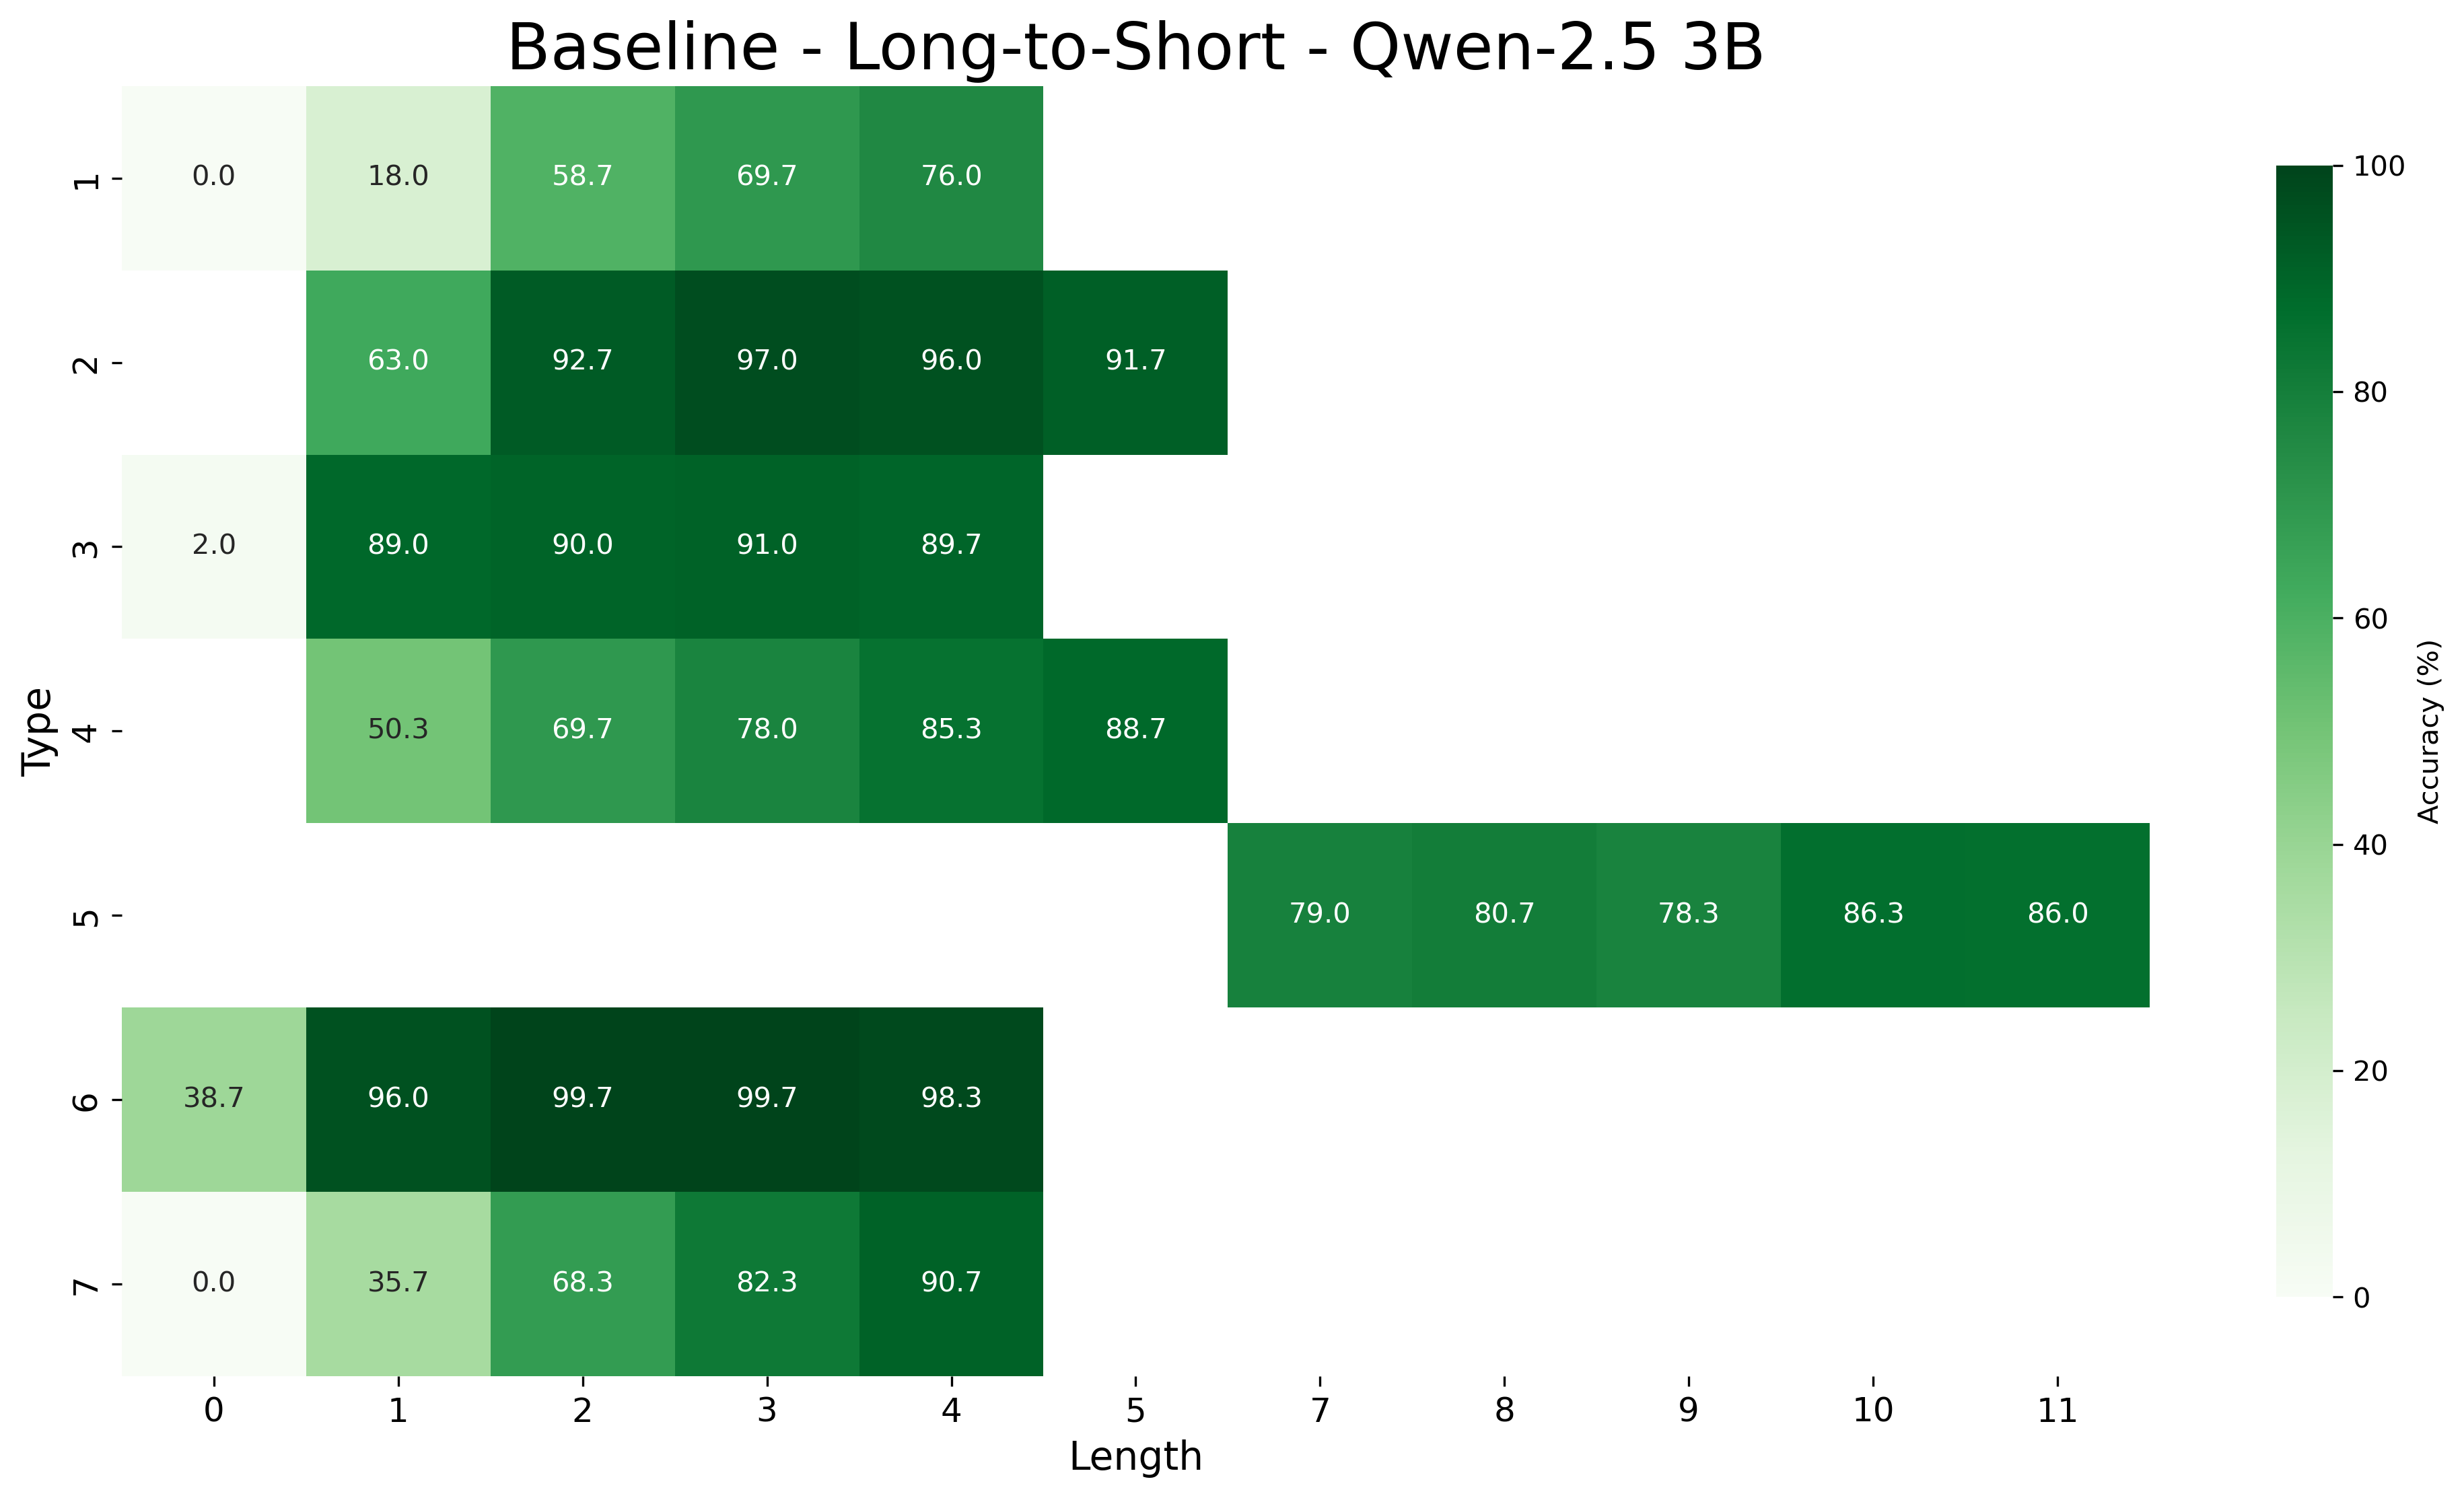
The image is a heatmap displaying accuracy percentages for different types of data across varying lengths. The heatmap uses a green color gradient, where darker shades of green represent higher accuracy and lighter shades represent lower accuracy. The data is organized by "Type" (1-7) on the vertical axis and "Length" (0-11) on the horizontal axis.
### Components/Axes
* **Title:** Baseline - Long-to-Short - Qwen-2.5 3B
* **Vertical Axis:** "Type" with categories 1, 2, 3, 4, 5, 6, 7.
* **Horizontal Axis:** "Length" with values 0, 1, 2, 3, 4, 7, 8, 9, 10, 11. Note that lengths 5 and 6 are missing.
* **Color Legend:** Located on the right side of the heatmap, labeled "Accuracy (%)". The color gradient ranges from light green (0%) to dark green (100%).
### Detailed Analysis
The heatmap presents accuracy values for each Type at different Lengths.
* **Type 1:**
* Length 0: 0.0%
* Length 1: 18.0%
* Length 2: 58.7%
* Length 3: 69.7%
* Length 4: 76.0%
* **Type 2:**
* Length 1: 63.0%
* Length 2: 92.7%
* Length 3: 97.0%
* Length 4: 96.0%
* Length 7: 91.7%
* **Type 3:**
* Length 0: 2.0%
* Length 1: 89.0%
* Length 2: 90.0%
* Length 3: 91.0%
* Length 4: 89.7%
* **Type 4:**
* Length 0: 50.3%
* Length 1: 69.7%
* Length 2: 78.0%
* Length 3: 85.3%
* Length 4: 88.7%
* **Type 5:**
* Length 7: 79.0%
* Length 8: 80.7%
* Length 9: 78.3%
* Length 10: 86.3%
* Length 11: 86.0%
* **Type 6:**
* Length 0: 38.7%
* Length 1: 96.0%
* Length 2: 99.7%
* Length 3: 99.7%
* Length 4: 98.3%
* **Type 7:**
* Length 0: 0.0%
* Length 1: 35.7%
* Length 2: 68.3%
* Length 3: 82.3%
* Length 4: 90.7%
### Key Observations
* Accuracy generally increases with length for Types 1, 4, and 7, at least up to length 4.
* Types 2, 3, and 6 show high accuracy across the lengths they are measured.
* Type 5 is only measured for lengths 7-11, with relatively consistent accuracy.
* Lengths 5 and 6 are missing from the data.
### Interpretation
The heatmap visualizes the performance of the "Qwen-2.5 3B" model under "Baseline - Long-to-Short" conditions. The data suggests that the model's accuracy varies significantly depending on the "Type" of data and the "Length". Some types (e.g., Type 6) consistently achieve high accuracy, while others (e.g., Type 1 at shorter lengths) perform poorly. The increasing accuracy with length for some types might indicate that the model benefits from more context. The missing lengths (5 and 6) could be due to experimental design or data availability.