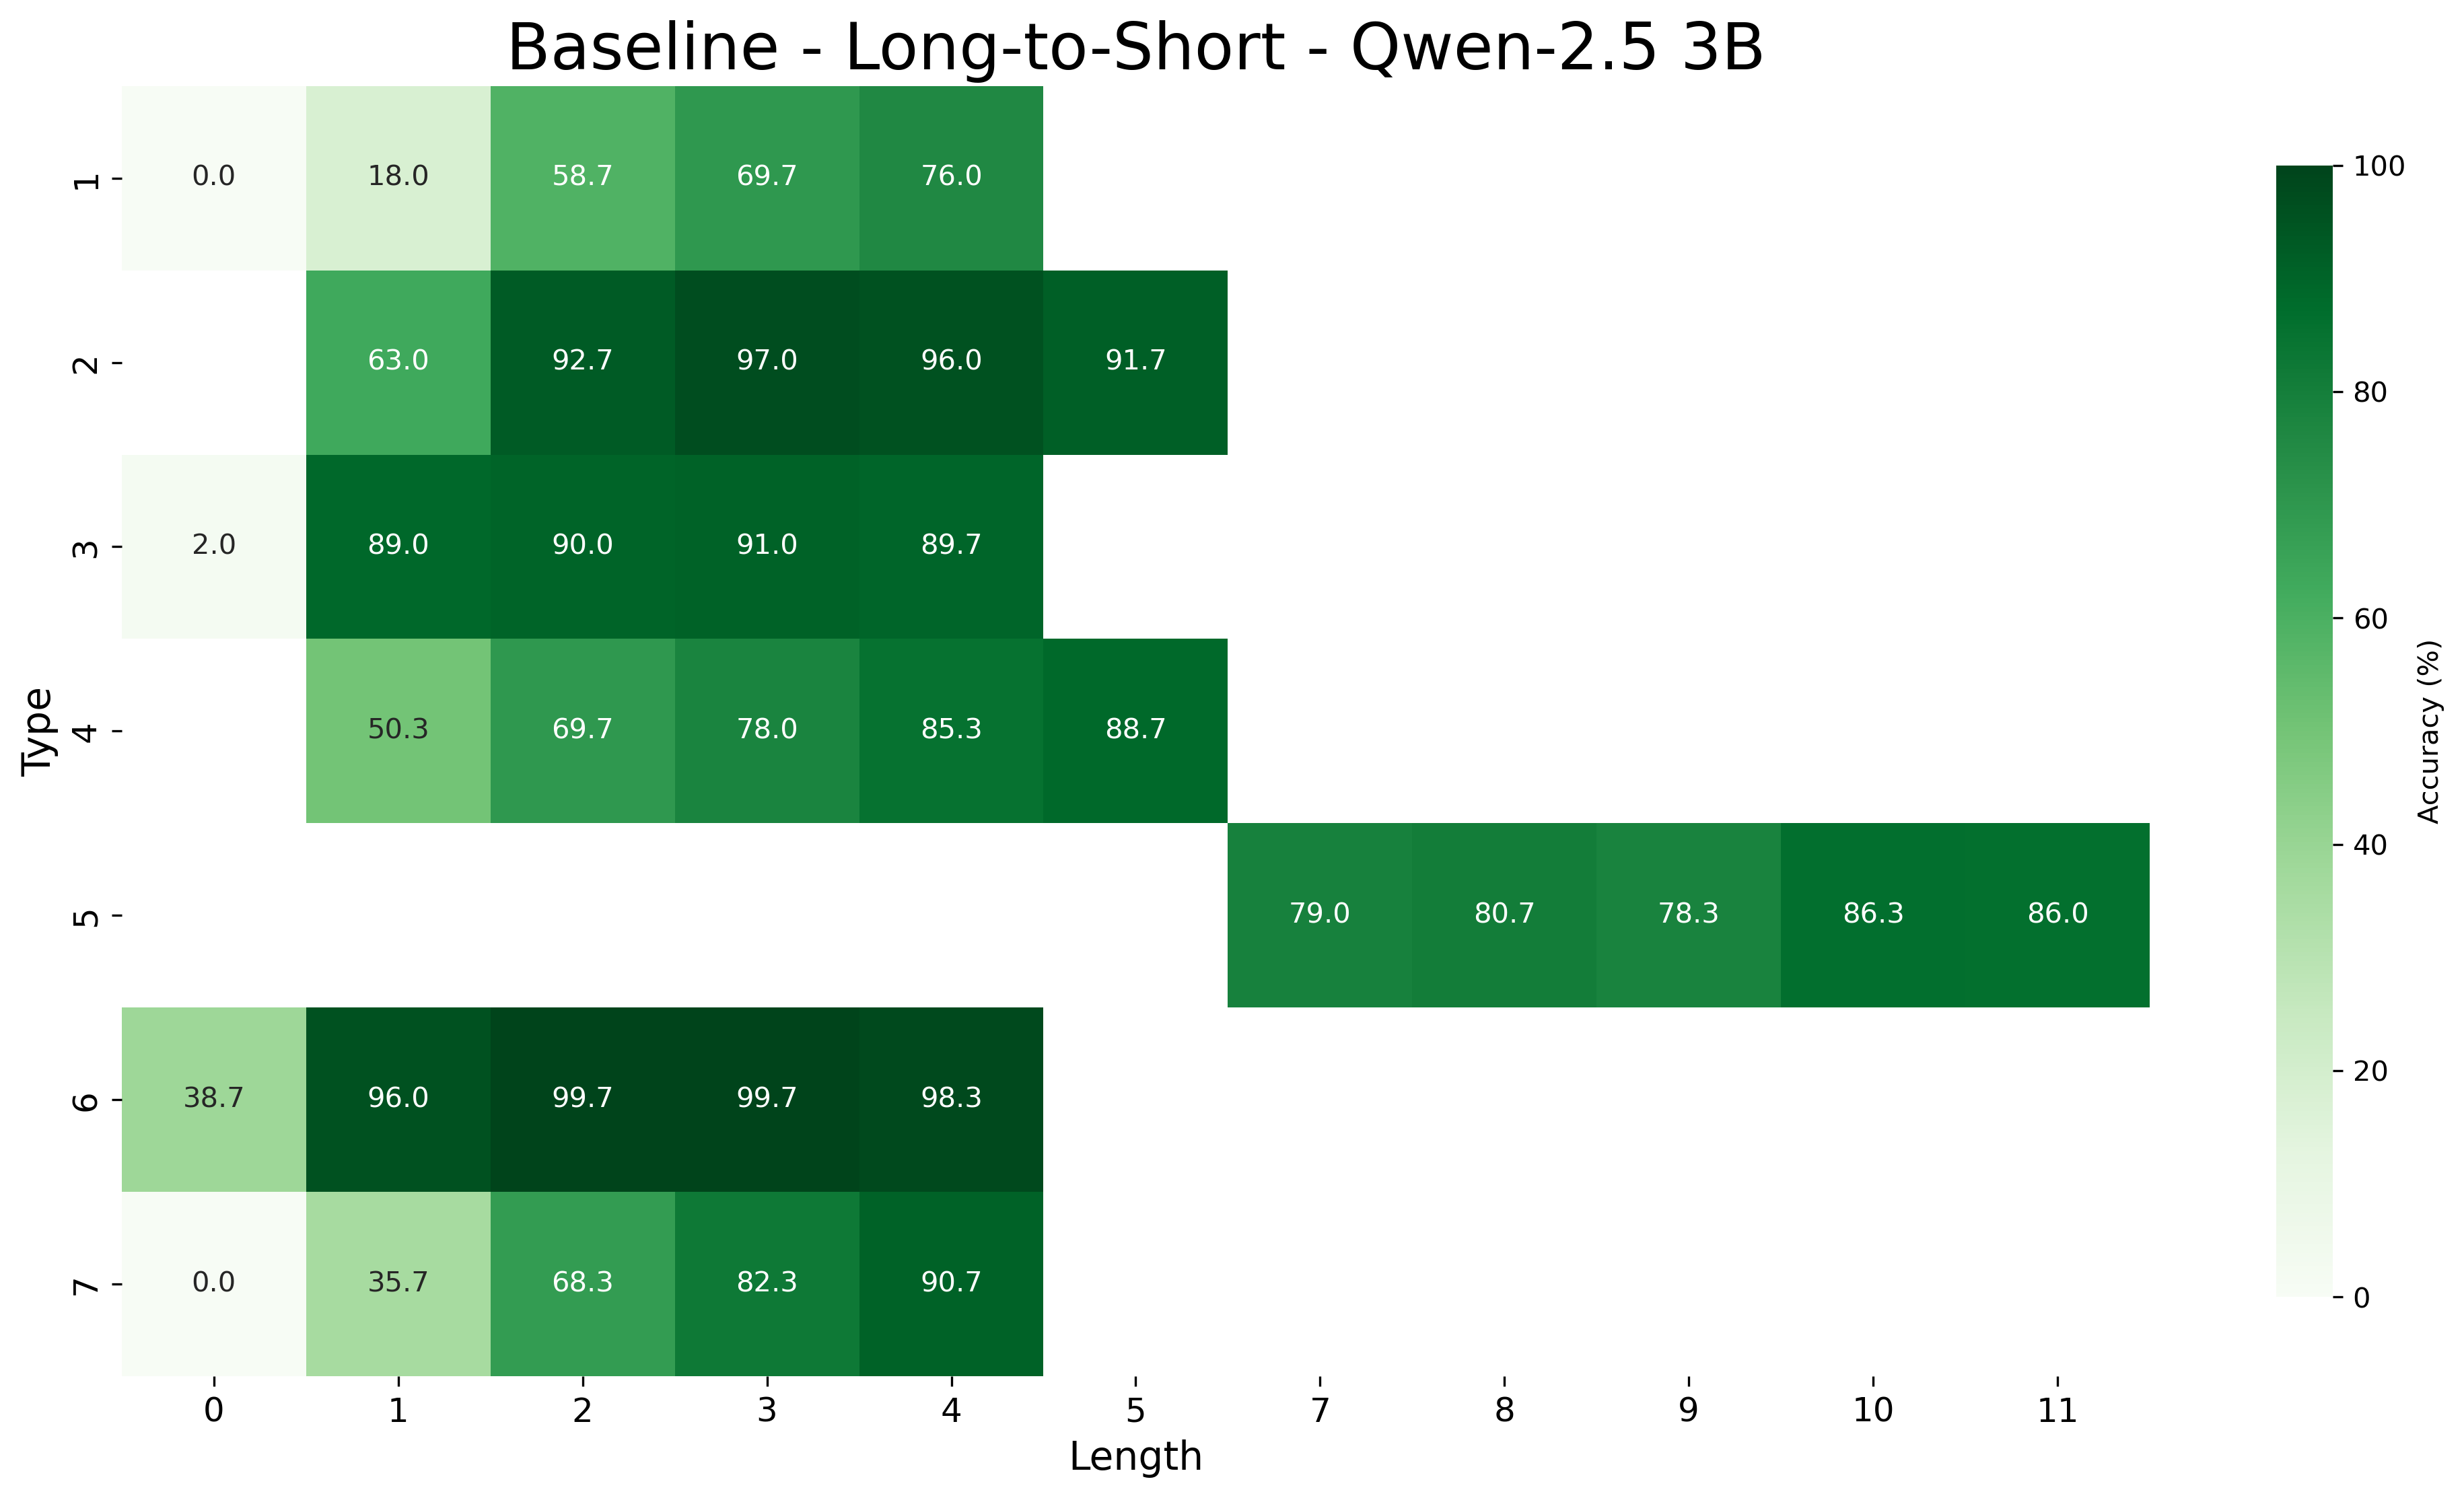
## Heatmap: Baseline - Long-to-Short - Qwen-2.5 3B
### Overview
This image presents a heatmap visualizing the accuracy of a model (Qwen-2.5 3B) in a Long-to-Short task, categorized by 'Type' and 'Length'. The heatmap uses a color gradient to represent accuracy, ranging from 0% (lightest shade) to 100% (darkest shade).
### Components/Axes
* **Title:** Baseline - Long-to-Short - Qwen-2.5 3B (positioned at the top-center)
* **X-axis:** Length, ranging from 0 to 11, with markers at integer values. Label: "Length" (bottom-center)
* **Y-axis:** Type, ranging from 1 to 7, with markers at integer values. Label: "Type" (left-center)
* **Color Scale/Legend:** A vertical color bar on the right side of the heatmap, representing Accuracy (%) from 0 to 100.
* **Data Cells:** Each cell represents the accuracy for a specific combination of Type and Length. The accuracy value is displayed within each cell.
### Detailed Analysis
The heatmap displays accuracy values for 7 Types (1-7) across 12 Lengths (0-11). The color intensity corresponds to the accuracy percentage.
Here's a breakdown of the data, reading row by row (Type 1 to Type 7):
* **Type 1:** Accuracy values are: 0.0 (Length 0), 18.0 (Length 1), 58.7 (Length 2), 69.7 (Length 3), 76.0 (Length 4).
* **Type 2:** Accuracy values are: 63.0 (Length 0), 92.7 (Length 1), 97.0 (Length 2), 96.0 (Length 3), 91.7 (Length 4).
* **Type 3:** Accuracy values are: 2.0 (Length 0), 89.0 (Length 1), 90.0 (Length 2), 91.0 (Length 3), 89.7 (Length 4).
* **Type 4:** Accuracy values are: 50.3 (Length 0), 69.7 (Length 1), 78.0 (Length 2), 85.3 (Length 3), 88.7 (Length 4).
* **Type 5:** Accuracy values are: 79.0 (Length 5), 80.7 (Length 6), 78.3 (Length 7), 86.3 (Length 8), 86.0 (Length 9).
* **Type 6:** Accuracy values are: 38.7 (Length 0), 96.0 (Length 1), 99.7 (Length 2), 99.7 (Length 3), 98.3 (Length 4).
* **Type 7:** Accuracy values are: 0.0 (Length 0), 35.7 (Length 1), 68.3 (Length 2), 82.3 (Length 3), 90.7 (Length 4).
### Key Observations
* **High Accuracy:** Types 2, 3, and 6 generally exhibit high accuracy (above 90%) for lengths 1-4.
* **Low Accuracy:** Types 1 and 7 show lower accuracy, particularly at shorter lengths (0-2). Type 1 has very low accuracy at length 0.
* **Length Dependence:** Accuracy generally increases with length for most types, but this trend isn't consistent across all types.
* **Type 5:** Type 5 only has data for lengths 5-9.
* **Outlier:** Type 3 has a relatively low accuracy of 2.0 at length 0, which is an outlier compared to its other values.
### Interpretation
The heatmap demonstrates the performance of the Qwen-2.5 3B model on a Long-to-Short task, broken down by Type and Length. The data suggests that the model performs well on certain types (2, 3, 6) and generally improves with increasing length. However, there are significant variations in accuracy depending on the type and length combination. The low accuracy for Type 1 and Type 7 at shorter lengths indicates that the model struggles with these types when the input is short. The outlier for Type 3 at length 0 suggests a potential issue with the model's handling of this specific combination.
The heatmap provides valuable insights into the model's strengths and weaknesses, which can be used to guide further development and optimization. The fact that accuracy generally increases with length suggests that the model benefits from more context. The differences in accuracy across types indicate that the model may be biased towards certain types of input.