## Heatmap: Baseline - Long-to-Short - Qwen-2.5 3B
### Overview
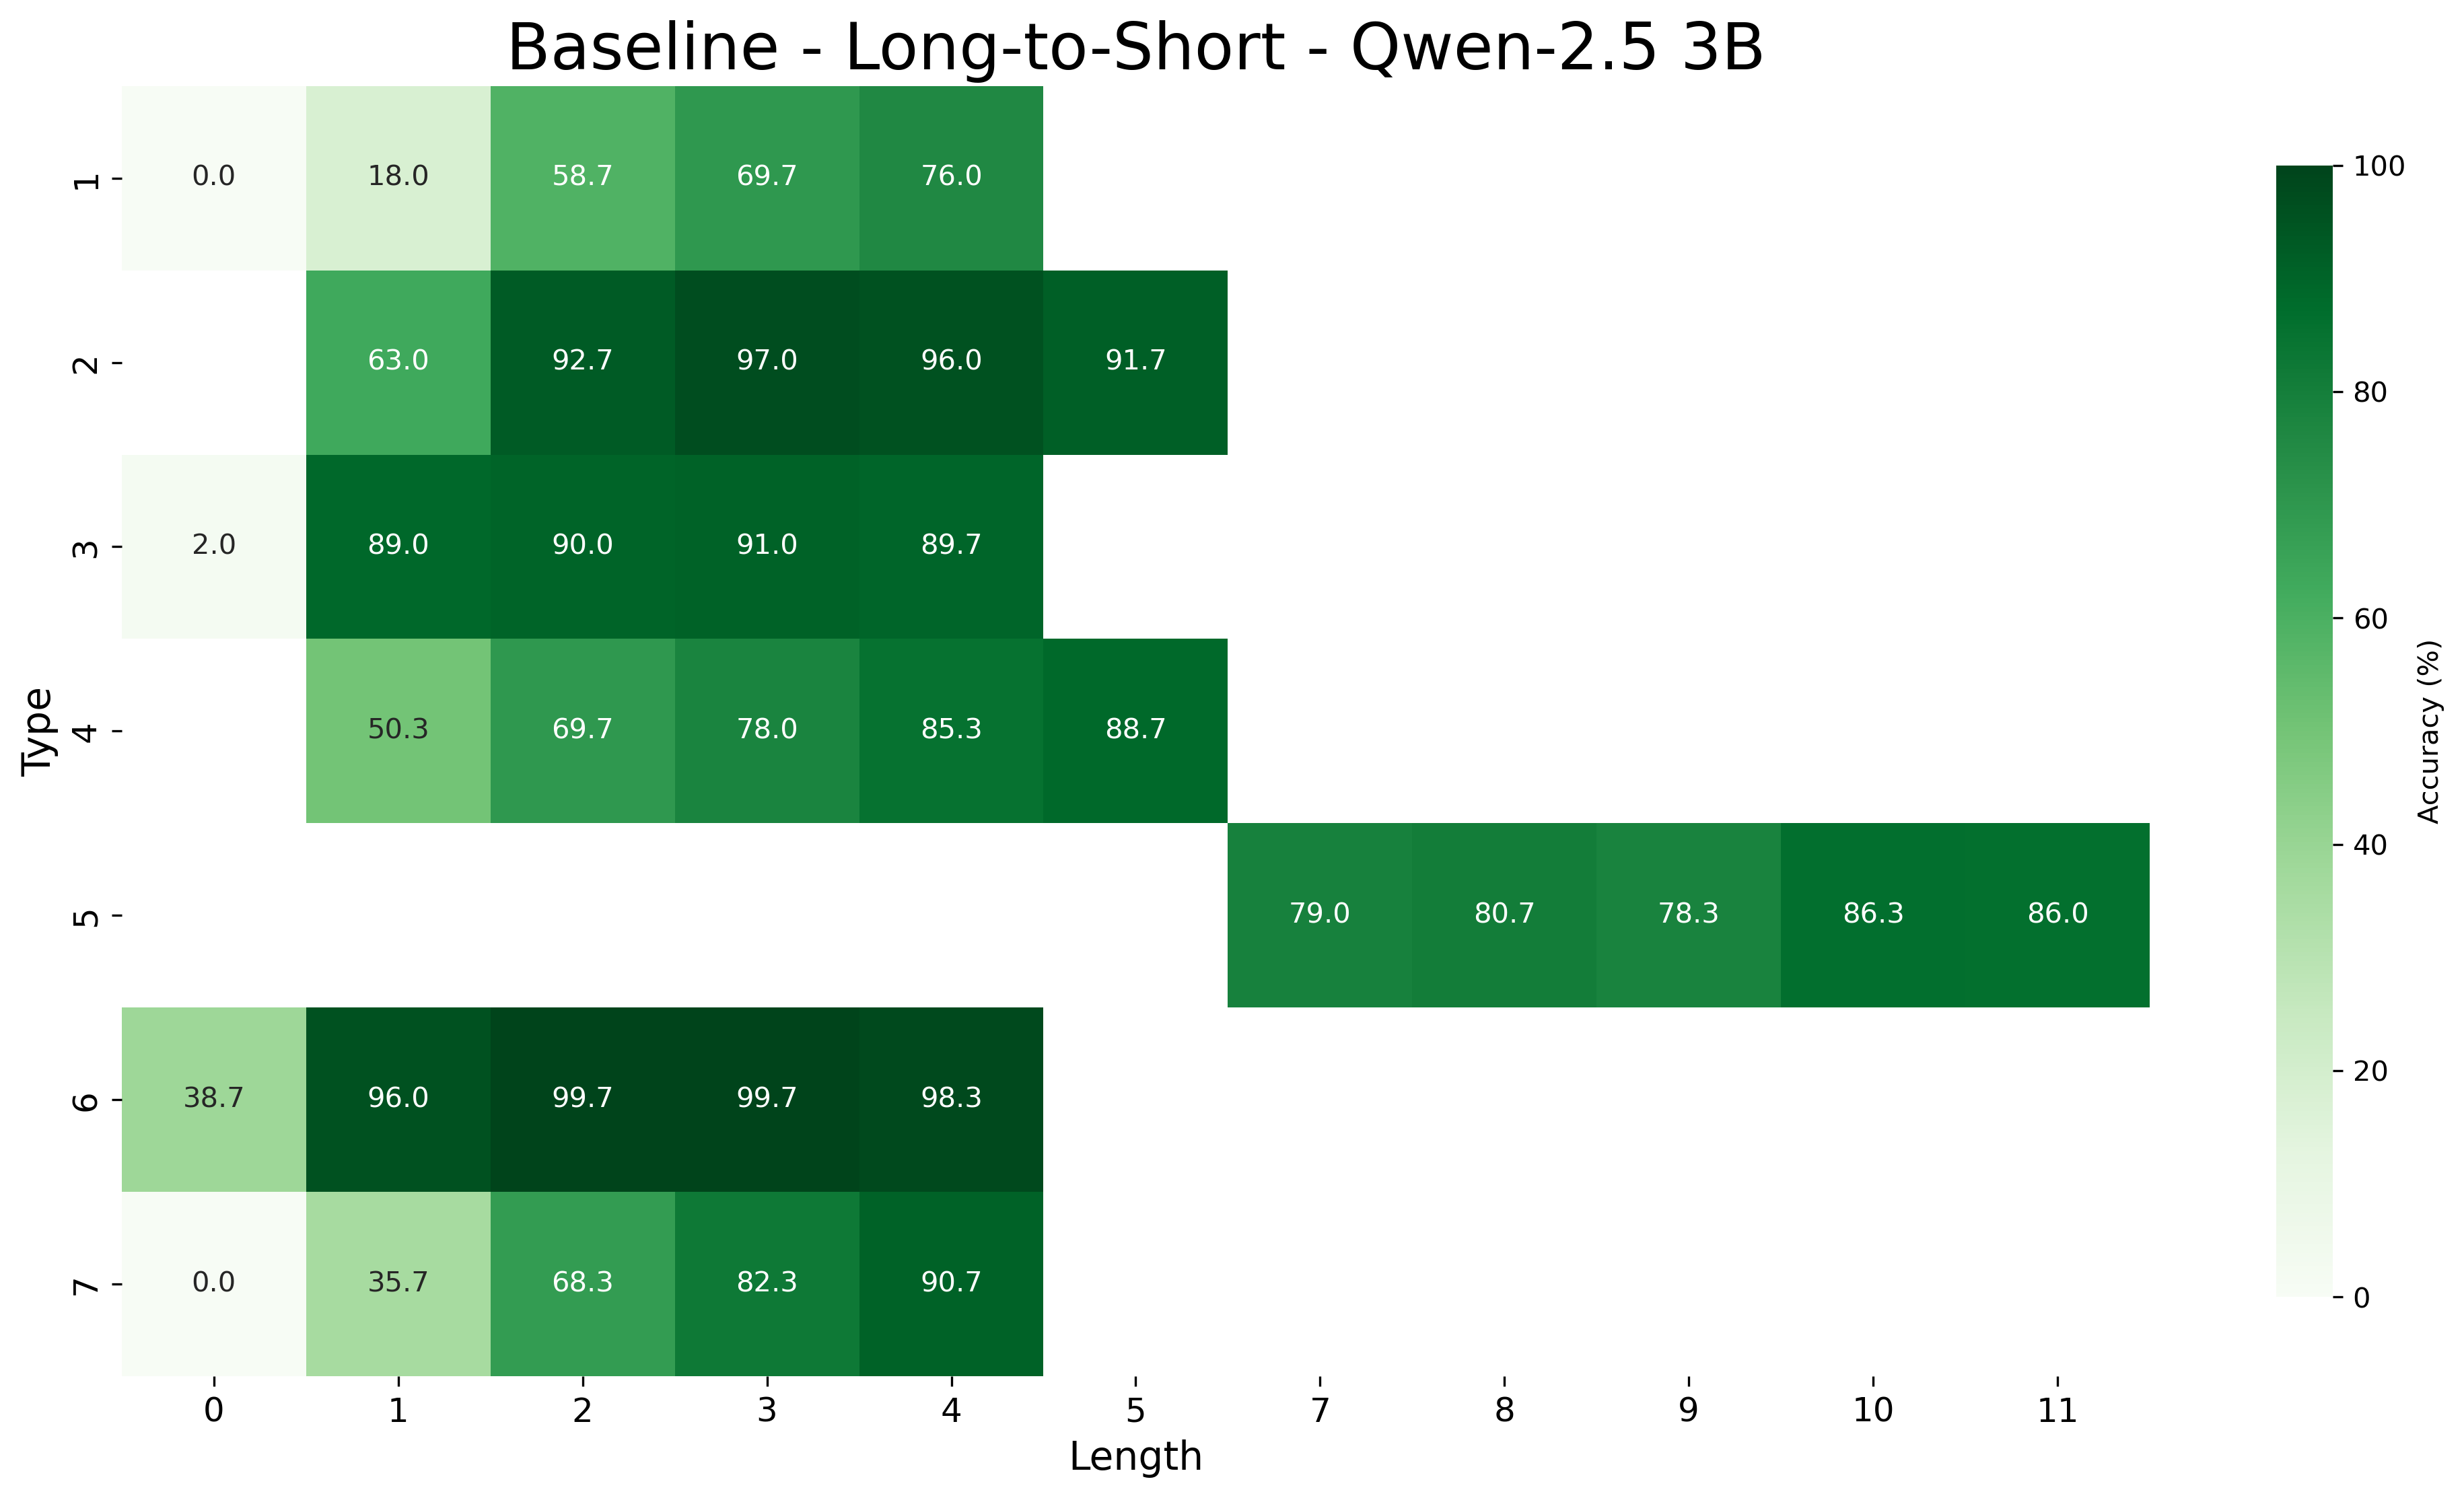
This image is a heatmap visualizing the accuracy percentage of a model named "Qwen-2.5 3B" on a "Long-to-Short" task. The performance is broken down by two categorical variables: "Type" (vertical axis, rows 1-7) and "Length" (horizontal axis, columns 0-11, with a gap at 6). The color intensity represents accuracy, with a legend on the right showing a gradient from light green (0%) to dark green (100%).
### Components/Axes
* **Title:** "Baseline - Long-to-Short - Qwen-2.5 3B" (centered at the top).
* **Vertical Axis (Y-axis):** Labeled "Type". It contains 7 discrete categories, numbered 1 through 7 from top to bottom.
* **Horizontal Axis (X-axis):** Labeled "Length". It contains discrete numerical markers: 0, 1, 2, 3, 4, 5, 7, 8, 9, 10, 11. There is no marker for length 6.
* **Legend/Color Bar:** Located on the right side of the chart. It is a vertical bar labeled "Accuracy (%)" with a scale from 0 to 100. The color gradient transitions from very light green (0) to dark forest green (100).
* **Data Cells:** The main body of the chart is a grid where each cell corresponds to a specific Type and Length. Each cell contains a numerical value representing the accuracy percentage and is colored according to the legend.
### Detailed Analysis
The following table reconstructs the data from the heatmap. Empty cells indicate no data was recorded for that Type-Length combination.
| Type | Length 0 | Length 1 | Length 2 | Length 3 | Length 4 | Length 5 | Length 7 | Length 8 | Length 9 | Length 10 | Length 11 |
| :--- | :--- | :--- | :--- | :--- | :--- | :--- | :--- | :--- | :--- | :--- | :--- |
| **1** | 0.0 | 18.0 | 58.7 | 69.7 | 76.0 | | | | | | |
| **2** | | 63.0 | 92.7 | 97.0 | 96.0 | 91.7 | | | | | |
| **3** | 2.0 | 89.0 | 90.0 | 91.0 | 89.7 | | | | | | |
| **4** | | 50.3 | 69.7 | 78.0 | 85.3 | 88.7 | | | | | |
| **5** | | | | | | | 79.0 | 80.7 | 78.3 | 86.3 | 86.0 |
| **6** | 38.7 | 96.0 | 99.7 | 99.7 | 98.3 | | | | | | |
| **7** | 0.0 | 35.7 | 68.3 | 82.3 | 90.7 | | | | | | |
**Trend Verification by Type:**
* **Type 1:** Shows a clear upward trend. Accuracy starts at 0.0% (Length 0) and increases steadily to 76.0% (Length 4).
* **Type 2:** Accuracy is high, starting at 63.0% (Length 1), peaking at 97.0% (Length 3), and slightly declining to 91.7% (Length 5).
* **Type 3:** Accuracy is consistently high (89.0%-91.0%) for Lengths 1-4, with a very low value (2.0%) at Length 0.
* **Type 4:** Shows a steady upward trend from 50.3% (Length 1) to 88.7% (Length 5).
* **Type 5:** Data exists only for longer lengths (7-11). Accuracy is relatively stable, ranging from 78.3% to 86.3%.
* **Type 6:** Exhibits very high accuracy. It starts at 38.7% (Length 0), jumps to 96.0% (Length 1), and peaks at 99.7% for Lengths 2 and 3.
* **Type 7:** Shows a strong upward trend from 0.0% (Length 0) to 90.7% (Length 4).
### Key Observations
1. **Variable Data Ranges:** Different "Types" are evaluated over different ranges of "Length". Types 1, 3, 6, and 7 have data for lengths 0-4. Types 2 and 4 have data for lengths 1-5. Type 5 is an outlier, with data only for lengths 7-11.
2. **Performance Extremes:** The highest accuracy values (99.7%) are found in Type 6 at Lengths 2 and 3. The lowest values (0.0%) are found in Types 1 and 7 at Length 0.
3. **General Trend:** For most Types where data is available across multiple lengths (1, 4, 6, 7), accuracy generally improves as the "Length" value increases.
4. **High-Performing Types:** Types 2, 3, and 6 demonstrate consistently high accuracy (mostly above 85%) across their respective tested lengths.
5. **Missing Data Point:** The x-axis skips the value 6, suggesting this length category was not part of the evaluation.
### Interpretation
This heatmap likely presents the results of an evaluation benchmark for the Qwen-2.5 3B language model on a "Long-to-Short" task, which may involve summarizing or condensing long inputs. The "Type" axis probably represents different task categories or prompt styles, while "Length" could correspond to input length, output length, or a complexity metric.
The data suggests that model performance is highly dependent on both the task type and the length parameter. The strong positive correlation between length and accuracy for several types (e.g., Type 1, 7) indicates the model may require a minimum amount of context or a certain scale to perform effectively. The exceptional performance of Type 6 suggests it is a particularly well-suited or easier task variant for this model. Conversely, the 0% accuracy at Length 0 for some types might represent a baseline failure mode or a control condition where the task is impossible to complete. The isolated data for Type 5 at longer lengths implies it is a distinct task category only applicable to higher length values. Overall, the chart provides a granular view of model strengths and weaknesses across a multidimensional task space.