# Technical Document Extraction: Baseline - Long-to-Short - Gwen-2.5 3B
## 1. Labels & Axis Titles
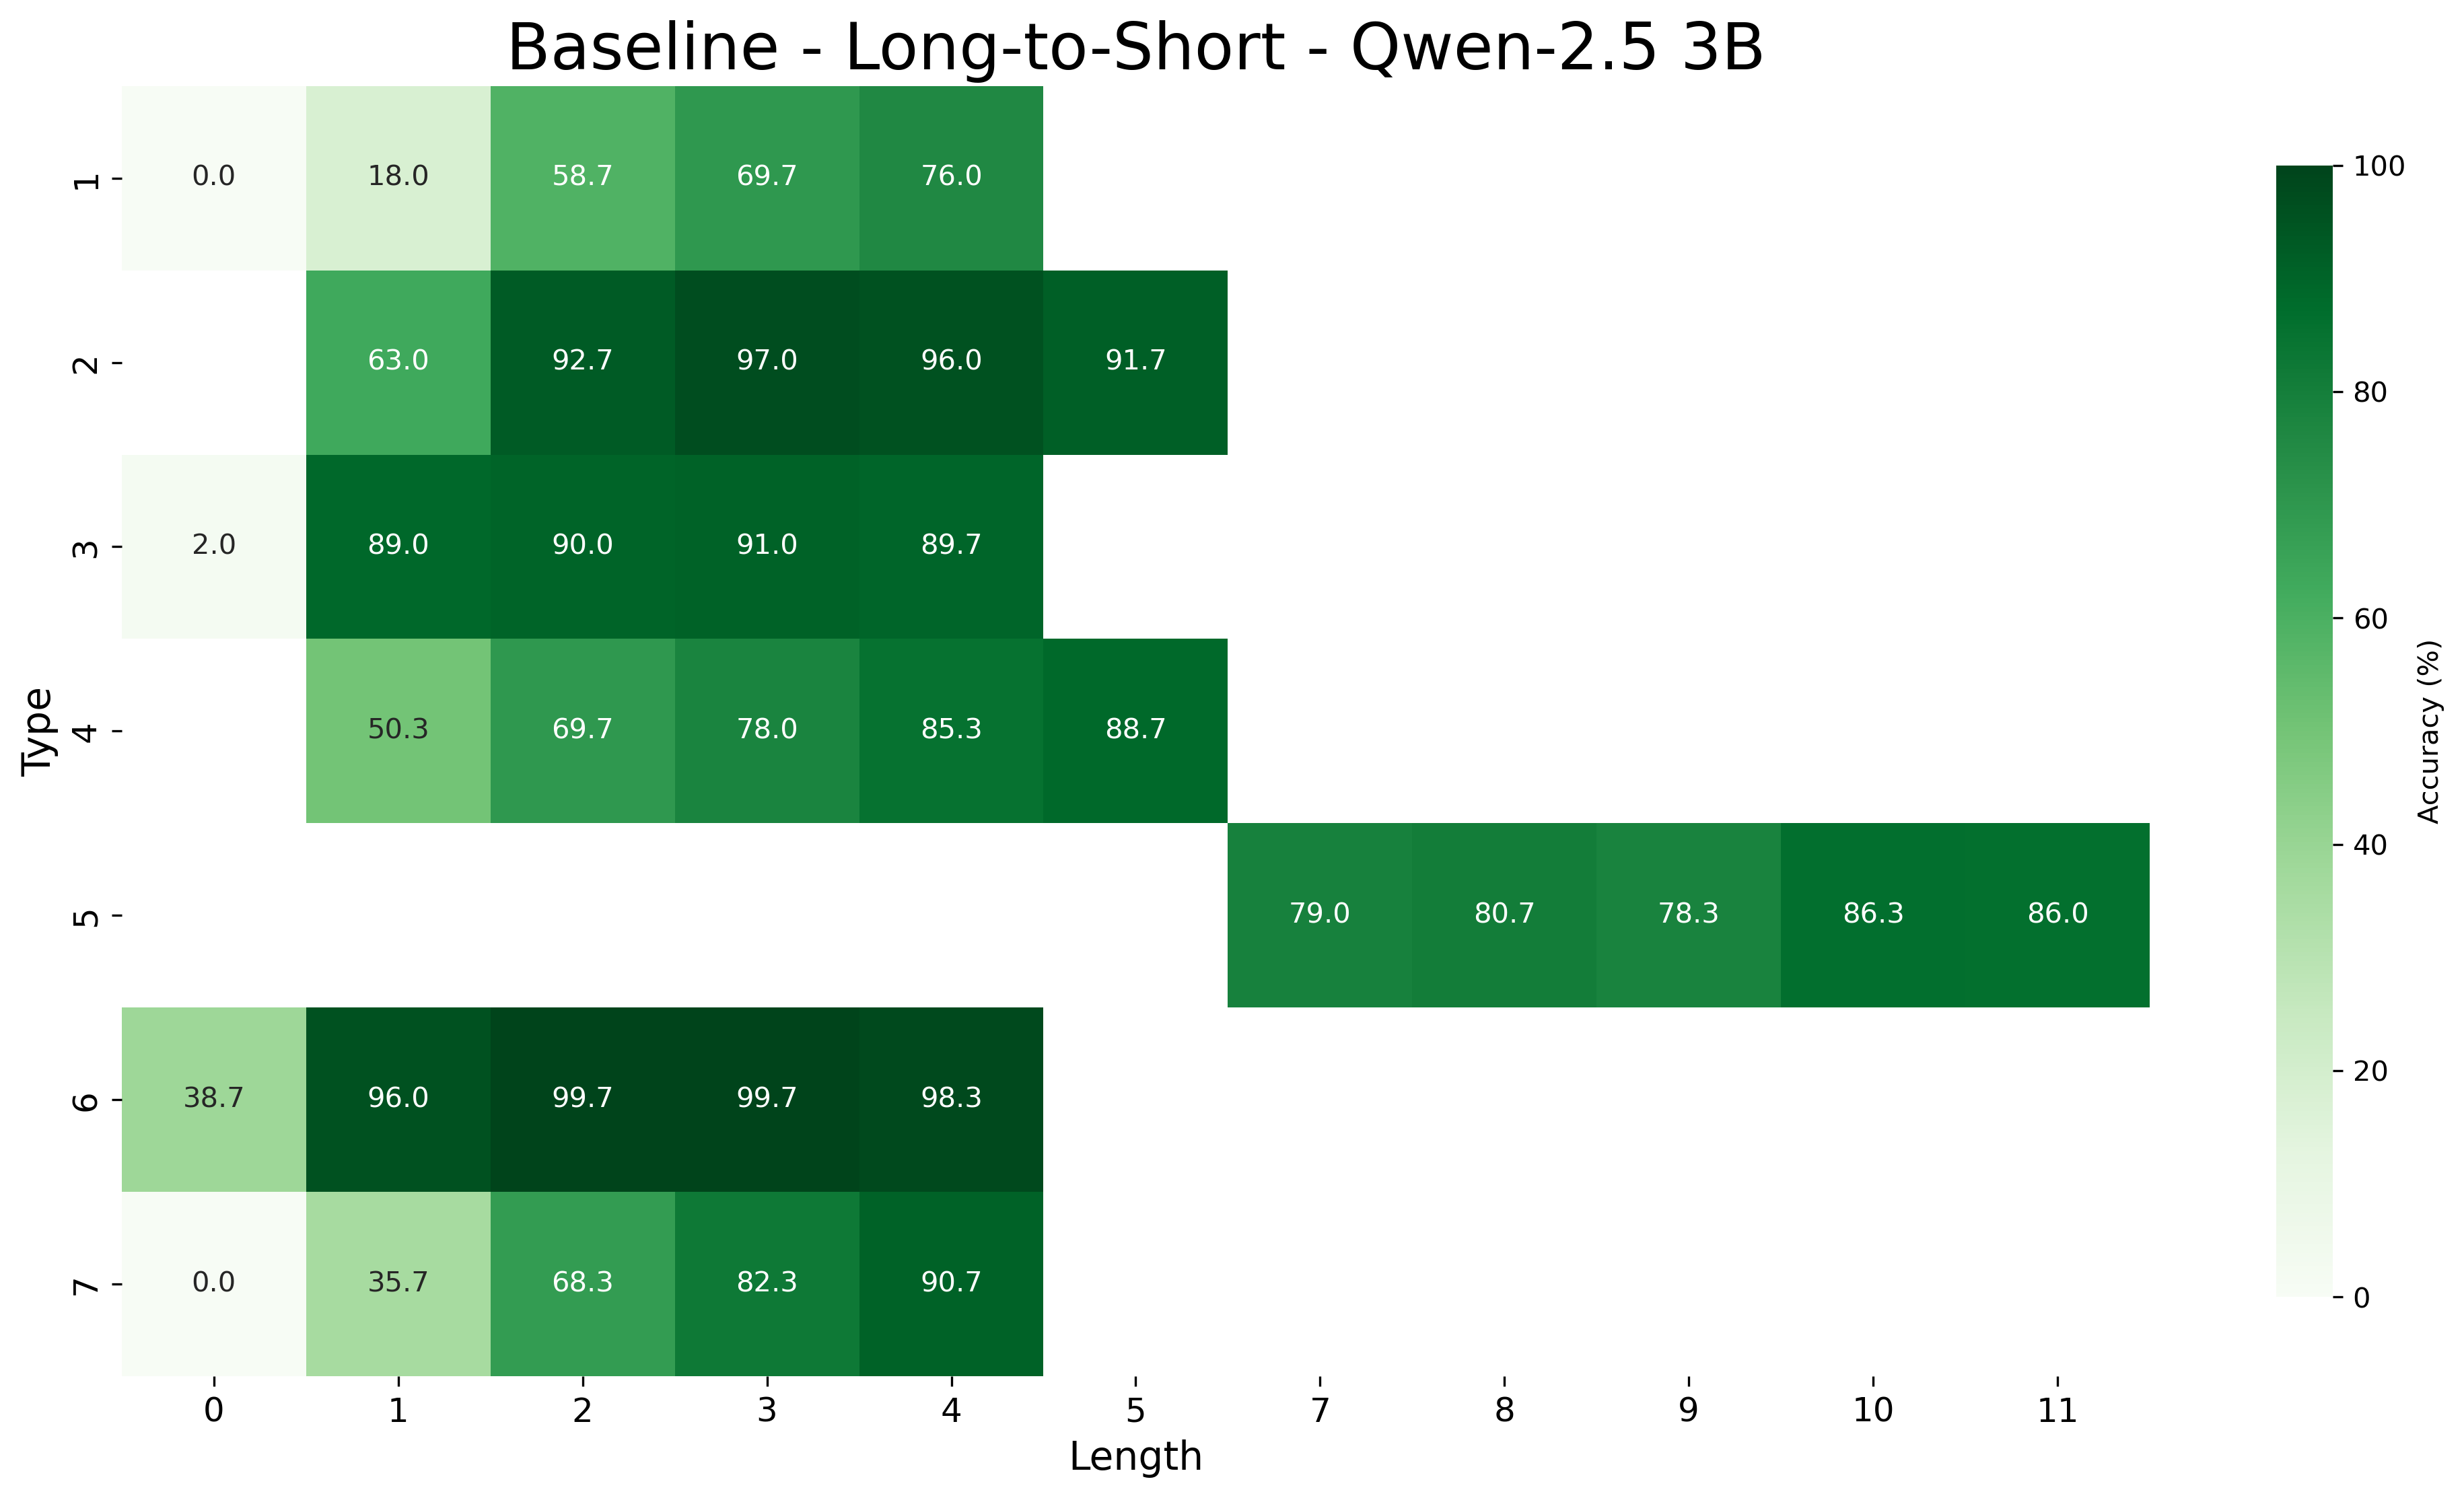
- **X-Axis**: "Length" (Categorical: 0–11)
- **Y-Axis**: "Type" (Categorical: 0–7)
- **Colorbar**: "Accuracy (%)" (Gradient: Light green → Dark green, 0%–100%)
## 2. Legend & Spatial Grounding
- **Legend**: Colorbar on the right side of the heatmap.
- **Color Correlation**:
- Light green = Low accuracy (0–40%)
- Dark green = High accuracy (80–100%)
## 3. Data Table Structure
| Type \ Length | 0 | 1 | 2 | 3 | 4 | 5 | 6 | 7 | 8 | 9 | 10 | 11 |
|---------------|------|------|------|------|------|------|------|------|------|------|------|------|
| 0 | 0.0 | 18.0 | 58.7 | 69.7 | 76.0 | | | | | | | |
| 1 | | 63.0 | 92.7 | 97.0 | 96.0 | 91.7 | | | | | | |
| 2 | 2.0 | 89.0 | 90.0 | 91.0 | 89.7 | | | | | | | |
| 3 | | 50.3 | 69.7 | 78.0 | 85.3 | 88.7 | | | | | | |
| 4 | | | | | | | 79.0 | 80.7 | 78.3 | 86.3 | 86.0 | |
| 5 | | | | | | | | | | | | |
| 6 | 38.7 | 96.0 | 99.7 | 99.7 | 98.3 | | | | | | | |
| 7 | 0.0 | 35.7 | 68.3 | 82.3 | 90.7 | | | | | | | |
## 4. Key Trends & Observations
### Type 0
- **Trend**: Gradual increase in accuracy with length.
- **Peak**: 76.0% at Length 4.
- **Lowest**: 0.0% at Length 0.
### Type 1
- **Trend**: High accuracy across all lengths.
- **Peak**: 97.0% at Length 3.
- **Lowest**: 63.0% at Length 1.
### Type 2
- **Trend**: Consistent high accuracy (89–91%).
- **Peak**: 91.0% at Length 3.
- **Lowest**: 2.0% at Length 0.
### Type 3
- **Trend**: Moderate accuracy, peaking at Length 4 (88.7%).
- **Lowest**: 50.3% at Length 1.
### Type 4
- **Trend**: Moderate accuracy, peaking at Length 4 (88.7%).
- **Lowest**: 50.3% at Length 1.
### Type 5
- **Trend**: Data missing (all cells empty).
### Type 6
- **Trend**: Exceptionally high accuracy (96–99.7%).
- **Peak**: 99.7% at Lengths 2–3.
- **Lowest**: 38.7% at Length 0.
### Type 7
- **Trend**: Gradual increase in accuracy with length.
- **Peak**: 90.7% at Length 4.
- **Lowest**: 0.0% at Length 0.
## 5. Color Verification
- **Dark Green Cells**: Correspond to values ≥90% (e.g., Type 1, Length 3: 97.0%).
- **Light Green Cells**: Correspond to values <40% (e.g., Type 0, Length 0: 0.0%).
## 6. Component Isolation
- **Header**: Title "Baseline - Long-to-Short - Gwen-2.5 3B".
- **Main Chart**: 8x12 heatmap with labeled axes and colorbar.
- **Footer**: No additional text or components.
## 7. Missing Data
- **Type 5**: Entire row contains no data (all cells empty).
## 8. Summary
The heatmap visualizes accuracy (%) of a "Long-to-Short" baseline model (Gwen-2.5 3B) across 8 types (0–7) and 12 lengths (0–11). Key patterns:
- **High Accuracy**: Types 1, 2, 6 (90–99.7%).
- **Low Accuracy**: Types 0, 3, 4, 7 (0–88.7%).
- **Missing Data**: Type 5 entirely absent.
- **Color Consistency**: Dark green cells align with ≥90% accuracy; light green with <40%.