## Line Chart: Relative Error vs. Iterations x Trials
### Overview
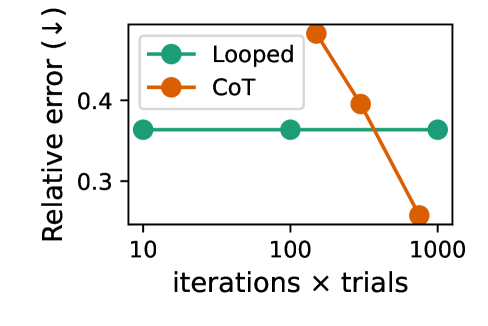
The image is a line chart comparing the relative error of two methods, "Looped" and "CoT", across different numbers of iterations multiplied by trials. The x-axis represents "iterations x trials" on a logarithmic scale, and the y-axis represents "Relative error (↓)". The chart shows that the "Looped" method maintains a relatively constant error, while the "CoT" method's error decreases as the number of iterations x trials increases.
### Components/Axes
* **X-axis:** "iterations x trials". The x-axis is marked with values 10, 100, and 1000, suggesting a logarithmic scale.
* **Y-axis:** "Relative error (↓)". The y-axis is marked with values 0.3 and 0.4. The arrow indicates that lower values represent better performance.
* **Legend:** Located in the top-left corner of the chart.
* **Looped:** Represented by a teal line.
* **CoT:** Represented by an orange line.
### Detailed Analysis
* **Looped (Teal):** The teal line representing the "Looped" method remains relatively constant across all values of "iterations x trials". The relative error is approximately 0.36.
* At 10 iterations x trials, the relative error is approximately 0.36.
* At 100 iterations x trials, the relative error is approximately 0.36.
* At 1000 iterations x trials, the relative error is approximately 0.36.
* **CoT (Orange):** The orange line representing the "CoT" method shows a decreasing relative error as "iterations x trials" increases.
* At 10 iterations x trials, the relative error is approximately 0.49.
* At 100 iterations x trials, the relative error is approximately 0.40.
* At 1000 iterations x trials, the relative error is approximately 0.26.
### Key Observations
* The "Looped" method maintains a consistent relative error regardless of the number of iterations x trials.
* The "CoT" method's relative error decreases as the number of iterations x trials increases, suggesting that it benefits from more iterations x trials.
* At lower values of "iterations x trials" (e.g., 10), the "Looped" method has a lower relative error than the "CoT" method.
* At higher values of "iterations x trials" (e.g., 1000), the "CoT" method has a lower relative error than the "Looped" method.
### Interpretation
The chart suggests that the "CoT" method is more effective when given a larger number of iterations x trials, as its relative error decreases significantly. The "Looped" method, on the other hand, provides a more consistent performance regardless of the number of iterations x trials. The choice between the two methods would depend on the computational resources available and the desired level of accuracy. If computational resources are limited, the "Looped" method might be preferred due to its consistent performance. If computational resources are abundant, the "CoT" method might be preferred as it can achieve a lower relative error with more iterations x trials.