\n
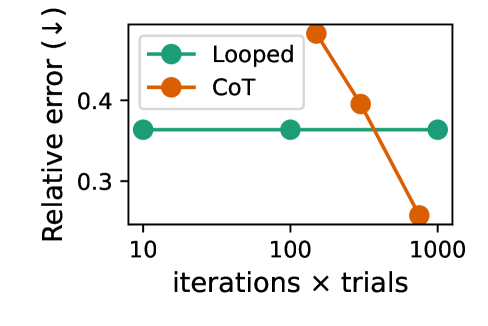
## Line Chart: Relative Error vs. Iterations x Trials
### Overview
This image presents a line chart comparing the relative error of two methods, "Looped" and "CoT" (Chain of Thought), as a function of the product of iterations and trials. The chart visually demonstrates how the relative error changes as the number of iterations and trials increases.
### Components/Axes
* **X-axis:** "iterations × trials" with markers at 10, 100, and 1000. The scale is logarithmic.
* **Y-axis:** "Relative error (↓)" indicating that lower values represent better performance. The scale ranges from approximately 0.3 to 0.5.
* **Legend:** Located in the top-left corner.
* "Looped" - represented by a teal/cyan line with circular markers.
* "CoT" - represented by an orange line with circular markers.
### Detailed Analysis
**Looped (Teal Line):**
The teal line representing "Looped" exhibits a relatively flat trend.
* At 10 iterations x trials, the relative error is approximately 0.37.
* At 100 iterations x trials, the relative error is approximately 0.37.
* At 1000 iterations x trials, the relative error is approximately 0.37.
**CoT (Orange Line):**
The orange line representing "CoT" shows a decreasing trend.
* At 10 iterations x trials, the relative error is approximately 0.44.
* At 100 iterations x trials, the relative error is approximately 0.40.
* At 1000 iterations x trials, the relative error is approximately 0.25.
### Key Observations
* The "Looped" method maintains a consistent relative error across all tested iterations x trials.
* The "CoT" method demonstrates a significant reduction in relative error as the number of iterations x trials increases.
* At 10 iterations x trials, "CoT" has a higher relative error than "Looped".
* At 1000 iterations x trials, "CoT" has a significantly lower relative error than "Looped".
### Interpretation
The data suggests that the "CoT" method benefits from increased iterations and trials, leading to improved performance (lower relative error). Conversely, the "Looped" method does not appear to improve with more iterations and trials, indicating a potential saturation point or inherent limitation. The initial higher error of "CoT" might be due to a slower initial learning phase, but the subsequent decrease demonstrates its ability to refine its results with more data and processing. This could indicate that "CoT" is more complex and requires more computational effort to converge to a better solution, while "Looped" is simpler but has a limited capacity for improvement. The downward arrow next to "Relative error" suggests that minimizing this value is the desired outcome, and the chart clearly shows "CoT" achieving this as iterations x trials increase.