## Line Chart: Relative Error vs. Computational Effort (Iterations × Trials)
### Overview
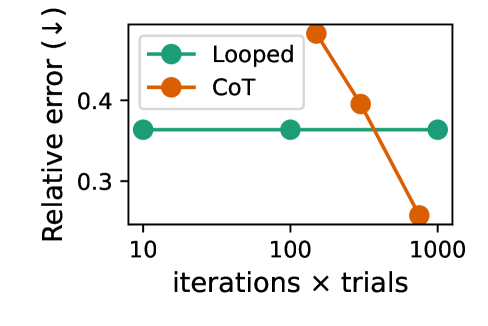
The image is a line chart comparing the performance of two methods, "Looped" and "CoT," as a function of increasing computational effort. The performance metric is "Relative error," where a lower value indicates better performance. The chart demonstrates how the error rates for the two methods change as the product of iterations and trials increases on a logarithmic scale.
### Components/Axes
* **Y-Axis (Vertical):**
* **Label:** `Relative error (↓)`
* **Scale:** Linear, ranging from approximately 0.25 to 0.5.
* **Markers:** Major ticks are visible at 0.3 and 0.4.
* **Note:** The downward arrow `(↓)` explicitly indicates that lower values are desirable.
* **X-Axis (Horizontal):**
* **Label:** `iterations × trials`
* **Scale:** Logarithmic (base 10).
* **Markers:** Major ticks at `10`, `100`, and `1000`.
* **Legend:**
* **Position:** Top-left corner of the chart area.
* **Series 1:** `Looped` - Represented by a teal/green line with circular markers.
* **Series 2:** `CoT` - Represented by an orange line with circular markers.
### Detailed Analysis
**Data Series: Looped (Teal/Green Line)**
* **Trend:** The line is perfectly horizontal, indicating no change in relative error as computational effort increases.
* **Data Points (Approximate):**
* At `iterations × trials = 10`: Relative error ≈ 0.36
* At `iterations × trials = 100`: Relative error ≈ 0.36
* At `iterations × trials = 1000`: Relative error ≈ 0.36
**Data Series: CoT (Orange Line)**
* **Trend:** The line slopes steeply downward, indicating a significant reduction in relative error as computational effort increases.
* **Data Points (Approximate):**
* At `iterations × trials ≈ 100`: Relative error ≈ 0.48 (This is the highest error point on the chart).
* At `iterations × trials ≈ 300`: Relative error ≈ 0.39.
* At `iterations × trials = 1000`: Relative error ≈ 0.26 (This is the lowest error point on the chart).
### Key Observations
1. **Performance Crossover:** The CoT method starts with a higher error than Looped at lower computational budgets (around 100 iterations×trials) but surpasses it (achieves lower error) at a higher budget (around 1000 iterations×trials).
2. **Scalability:** The Looped method shows zero scalability with respect to the `iterations × trials` metric; its performance is static. In contrast, the CoT method demonstrates strong, positive scalability.
3. **Magnitude of Change:** The CoT method's error reduces by nearly half (from ~0.48 to ~0.26) as the computational budget increases from ~100 to 1000 on the log scale.
### Interpretation
This chart illustrates a classic trade-off between a method with fixed performance ("Looped") and a method whose performance improves with more resources ("CoT").
* **What the data suggests:** The "CoT" (likely "Chain-of-Thought") method benefits substantially from increased computational investment. The "Looped" method appears to be a baseline or a method that has reached its performance ceiling and cannot leverage additional iterations or trials for improvement.
* **How elements relate:** The logarithmic x-axis is crucial. It shows that achieving the performance gain from CoT requires an *order-of-magnitude* increase in computational effort (from 100 to 1000). The crossover point suggests there is a minimum resource threshold required for CoT to become the superior choice.
* **Notable implications:** For resource-constrained scenarios (low `iterations × trials`), the simpler "Looped" method may be preferable. For scenarios where high accuracy is critical and computational resources are abundant, "CoT" is the clearly superior approach. The chart argues that the investment in CoT's computational cost pays off in reduced error.