# Technical Document Extraction: Image Analysis
## Overview
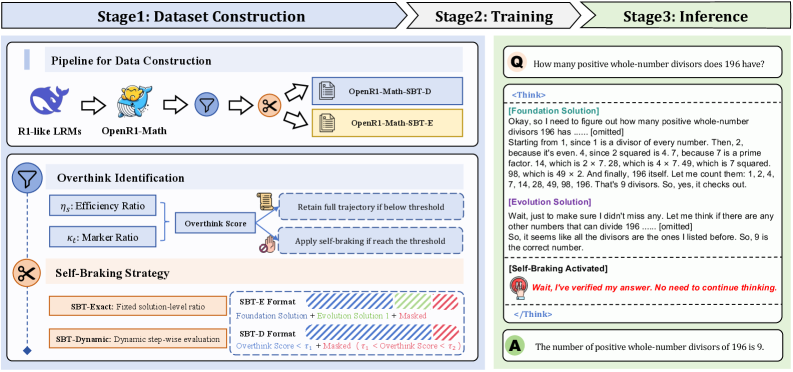
The image depicts a three-stage pipeline for a reasoning system, combining dataset construction, training, and inference processes. The diagram uses flowcharts, text blocks, and color-coded components to illustrate the system's architecture and operational logic.
---
## Stage 1: Dataset Construction
### Pipeline Components
1. **R1-like LRMs** → **OpenR1-Math** → **OpenR1-Math-SBT-D**
- Arrows indicate sequential processing.
- Symbols:
- 🐋 (Blue whale) for R1-like LRMs
- 🐱 (Yellow creature) for OpenR1-Math
- 🔁 (Recycling symbol) for OpenR1-Math-SBT-D
### Overthink Identification
- **Metrics**:
- `η_s`: Efficiency Ratio
- `κ_c`: Marker Ratio
- **Decision Logic**:
- Retain full trajectory if below threshold
- Apply self-braking if threshold exceeded
### Self-Braking Strategy
- **SBT-Exact**: Fixed solution-level ratio
- **SBT-Dynamic**: Dynamic step-wise evaluation
- **Formats**:
- **SBT-E**: Foundation Solution + Evolution Solution + Masked
- **SBT-D**: Overthink Score (`< r₁`) + Masked (`< r₁`)
---
## Stage 2: Training
### Example Workflow
**Question**:
"How many positive whole-number divisors does 196 have?"
**Process**:
1. **Foundation Solution**:
- "Okay, so I need to figure out how many positive whole-number divisors 196 has. Starting from 1, since 1 is a divisor of every number. Then 2, 4, 7, 14, 28, 49, 98, 196. That's 9 divisors."
2. **Evolution Solution**:
- "Wait, just to make sure I didn't miss any. Let me think if there are any other numbers that can divide 196. So, it seems like all the divisors are the ones I listed before. So, 9 is the correct number."
3. **Self-Braking Activation**:
- "Wait, I've verified my answer. No need to continue thinking."
---
## Stage 3: Inference
### Final Output
**Answer**:
"The number of positive whole-number divisors of 196 is 9."
---
## Diagram Components and Flow
### Spatial Grounding
- **Legend**: Integrated into the flowchart (no explicit coordinates). Colors correspond to:
- Blue: R1-like LRMs
- Yellow: OpenR1-Math
- Red: OpenR1-Math-SBT-D
- Green: Overthink Identification
- Orange: Self-Braking Strategy
### Flowchart Structure
1. **Header**: "Stage1: Dataset Construction" → "Stage2: Training" → "Stage3: Inference"
2. **Main Chart**:
- Left: Dataset construction pipeline with metrics and strategies.
- Right: Training example with nested reasoning steps.
3. **Footer**: Inference output with final answer.
---
## Textual Content Extraction
### Key Labels and Text
- **Pipeline for Data Construction**: Connects R1-like LRMs to OpenR1-Math-SBT-D.
- **Overthink Identification**: Metrics (`η_s`, `κ_c`) and decision thresholds.
- **Self-Braking Strategy**: SBT-Exact (fixed ratio) vs. SBT-Dynamic (step-wise evaluation).
- **Example Question**: Divisors of 196 (transcribed verbatim).
- **Self-Braking Activation**: Explicit termination of reasoning.
---
## Notes
- No traditional charts (e.g., heatmaps, line graphs) are present. The diagram focuses on process flow and decision logic.
- All text is in English; no additional languages detected.
- Colors in the diagram are symbolic (e.g., blue whale for R1-like LRMs) but lack a formal legend with coordinates.
---
## Conclusion
The image outlines a reasoning system with three stages: dataset construction (pipeline and metrics), training (example workflow with self-braking), and inference (final answer). The flowchart emphasizes efficiency ratios, dynamic evaluation, and automated termination of reasoning steps.