## Line Graph: Effective Dimension vs. log₁₀(2m+1)
### Overview
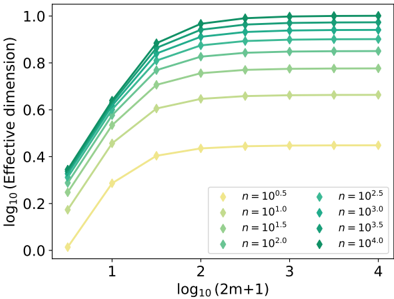
The image is a line graph comparing the **logarithmic effective dimension** (y-axis) against **log₁₀(2m+1)** (x-axis) for multiple datasets. Each dataset is represented by a distinct line with unique markers and colors, corresponding to different values of `n` (ranging from 10⁰.⁵ to 10⁴.⁰). The graph shows trends in how the effective dimension evolves as `log₁₀(2m+1)` increases, with saturation effects observed at higher `m` values.
---
### Components/Axes
- **X-axis**: Labeled `log₁₀(2m+1)`, with values ranging from 1 to 4 (log scale).
- **Y-axis**: Labeled `log₁₀(Effective dimension)`, with values from 0.0 to 1.0 (log scale).
- **Legend**: Located at the bottom-right corner, mapping colors/markers to `n` values:
- `n = 10⁰.⁵` (yellow diamonds)
- `n = 10¹.⁰` (light green diamonds)
- `n = 10¹.⁵` (green diamonds)
- `n = 10².⁰` (dark green diamonds)
- `n = 10².⁵` (teal diamonds)
- `n = 10³.⁰` (dark teal diamonds)
- `n = 10³.⁵` (light blue diamonds)
- `n = 10⁴.⁰` (dark blue diamonds)
---
### Detailed Analysis
1. **Line Trends**:
- **Low `n` values** (e.g., `n = 10⁰.⁵`): Lines start near 0.0 at `log₁₀(2m+1) = 1` and plateau at ~0.4 by `log₁₀(2m+1) = 4`.
- **Mid-range `n` values** (e.g., `n = 10¹.⁰` to `n = 10².⁰`): Lines rise steeply initially, then flatten. For example, `n = 10².⁰` reaches ~0.8 at `log₁₀(2m+1) = 3` and stabilizes.
- **High `n` values** (e.g., `n = 10³.⁰` to `n = 10⁴.⁰`): Lines start higher (e.g., ~0.3 at `log₁₀(2m+1) = 1`) and plateau near 1.0 by `log₁₀(2m+1) = 4`.
2. **Data Points**:
- **`n = 10⁰.⁵`**:
- At `log₁₀(2m+1) = 1`: ~0.0
- At `log₁₀(2m+1) = 4`: ~0.4
- **`n = 10⁴.⁰`**:
- At `log₁₀(2m+1) = 1`: ~0.3
- At `log₁₀(2m+1) = 4`: ~1.0
3. **Saturation**: All lines plateau at higher `log₁₀(2m+1)` values, suggesting diminishing returns in effective dimension growth as `m` increases.
---
### Key Observations
- **Higher `n` values** consistently yield higher effective dimensions across all `log₁₀(2m+1)` ranges.
- **Saturation effect**: Beyond `log₁₀(2m+1) ≈ 3–4`, effective dimension growth slows or stops for all `n`.
- **Steepest growth**: Mid-range `n` values (e.g., `n = 10¹.⁵` to `n = 10².⁰`) show the most rapid initial increases.
---
### Interpretation
The graph demonstrates a **logarithmic relationship** between `log₁₀(2m+1)` and effective dimension, with `n` acting as a scaling factor. Higher `n` values amplify the effective dimension, but the system reaches a saturation point where further increases in `m` (and thus `log₁₀(2m+1)`) have minimal impact. This suggests a **capacity limit** in the modeled system, where larger `n` improves performance up to a threshold. The plateauing behavior implies that beyond a certain complexity (`m`), additional resources (`n`) cannot significantly enhance the effective dimension.
**Notable Anomaly**: The `n = 10⁴.⁰` line starts higher than others at `log₁₀(2m+1) = 1`, indicating a baseline advantage for very large `n` even at low `m`.