## Line Chart: Throughput Comparison of A100 vs. V100 GPUs
### Overview
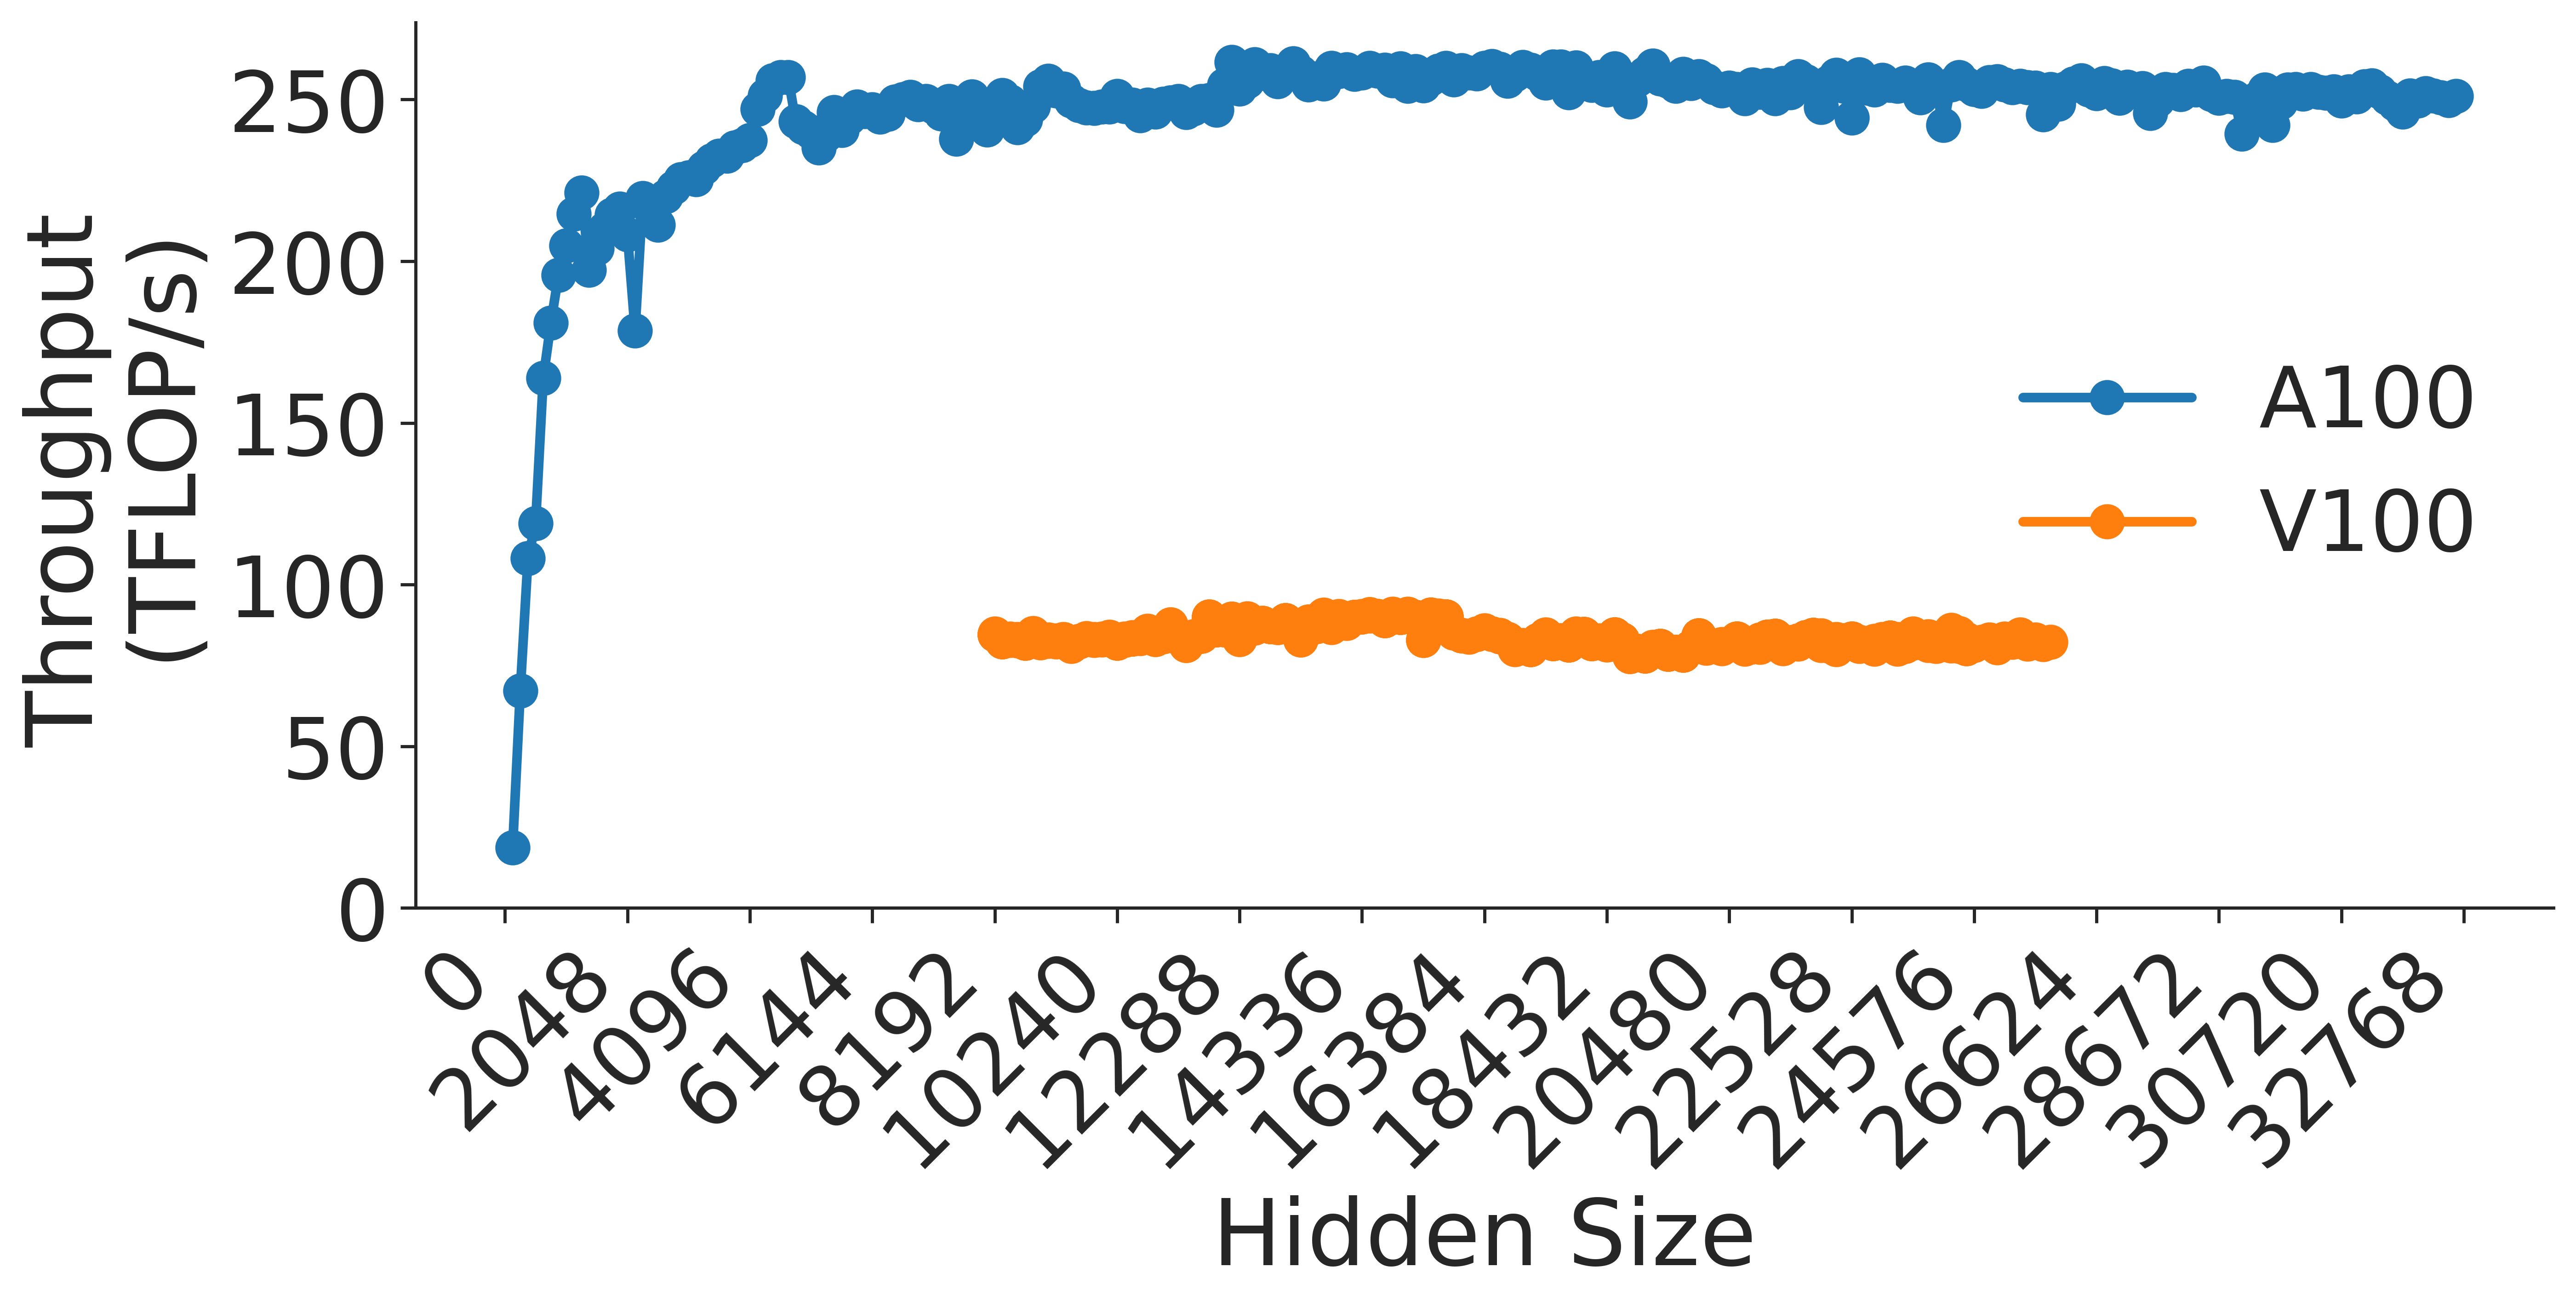
This image is a line chart comparing the computational throughput (measured in TFLOP/s) of two GPU architectures, the NVIDIA A100 and the NVIDIA V100, as a function of "Hidden Size." The chart demonstrates that the A100 provides significantly higher throughput and a wider operational range compared to the V100.
### Components/Axes
* **Y-Axis (Vertical):** Labeled "Throughput (TFLOP/s)". The scale ranges from 0 to 250, with major tick marks every 50 units.
* **X-Axis (Horizontal):** Labeled "Hidden Size". The scale ranges from 0 to 32768. The specific tick marks are: 0, 2048, 4096, 6144, 8192, 10240, 12288, 14336, 16384, 18432, 20480, 22528, 24576, 26624, 30720, 32768.
* **Legend:** Located on the right-center of the chart area.
* **Blue line with circular markers:** Labeled "A100".
* **Orange line with circular markers:** Labeled "V100".
### Detailed Analysis
#### A100 Series (Blue Line)
* **Trend:** The A100 series shows a rapid, near-linear increase in throughput starting from 0 hidden size, reaching a plateau around 250 TFLOP/s.
* **Data Points:**
* **Start:** Begins at (0, ~20 TFLOP/s).
* **Growth Phase:** Throughput climbs steeply, reaching ~200 TFLOP/s by a hidden size of ~1500.
* **Anomaly/Jitter:** There is a notable, sharp dip in performance between hidden sizes 3000 and 4000, where throughput drops from approximately 220 TFLOP/s down to ~180 TFLOP/s before recovering.
* **Plateau:** After the recovery (post-4096), the throughput stabilizes, oscillating slightly between 240 and 255 TFLOP/s for the remainder of the X-axis range up to 32768.
#### V100 Series (Orange Line)
* **Trend:** The V100 series shows a flat, stable performance profile. It does not appear to have a "warm-up" phase visible on this chart, as it starts directly at a high throughput level.
* **Data Points:**
* **Range:** The data series begins at a hidden size of 10240 and terminates at 26624.
* **Throughput:** The values remain consistently between 80 and 90 TFLOP/s throughout the entire duration of the series.
### Key Observations
* **Performance Gap:** The A100 consistently outperforms the V100 by a factor of approximately 3x (250 TFLOP/s vs. ~85 TFLOP/s).
* **Operational Range:** The A100 was tested across the full spectrum of hidden sizes (0 to 32768), whereas the V100 data is truncated, likely due to memory limitations (Out of Memory errors) at higher hidden sizes or simply not being tested beyond 26624.
* **Stability:** The A100 exhibits a "warm-up" curve and a specific performance dip at lower hidden sizes, whereas the V100 maintains a very steady, flat performance profile within its tested range.
### Interpretation
The data suggests that the A100 is significantly more efficient and powerful for the workload being tested (likely a neural network layer operation, given the "Hidden Size" terminology).
The "warm-up" phase of the A100 indicates that at very small hidden sizes, the GPU is likely underutilized or bound by kernel launch overheads rather than raw compute power. The dip around 3000-4000 hidden size is an interesting anomaly; it may represent a transition point where the workload switches from one compute kernel to another, or where memory access patterns become less efficient before optimizing again at larger sizes.
The V100's flat line suggests it is compute-bound immediately upon entering the tested range, and its inability to scale to the higher hidden sizes (where the A100 continues to operate) strongly implies that the V100 lacks the memory capacity (HBM) to handle the larger tensors required for those hidden sizes.