# Technical Document Extraction: GPU Throughput Analysis
## Chart Description
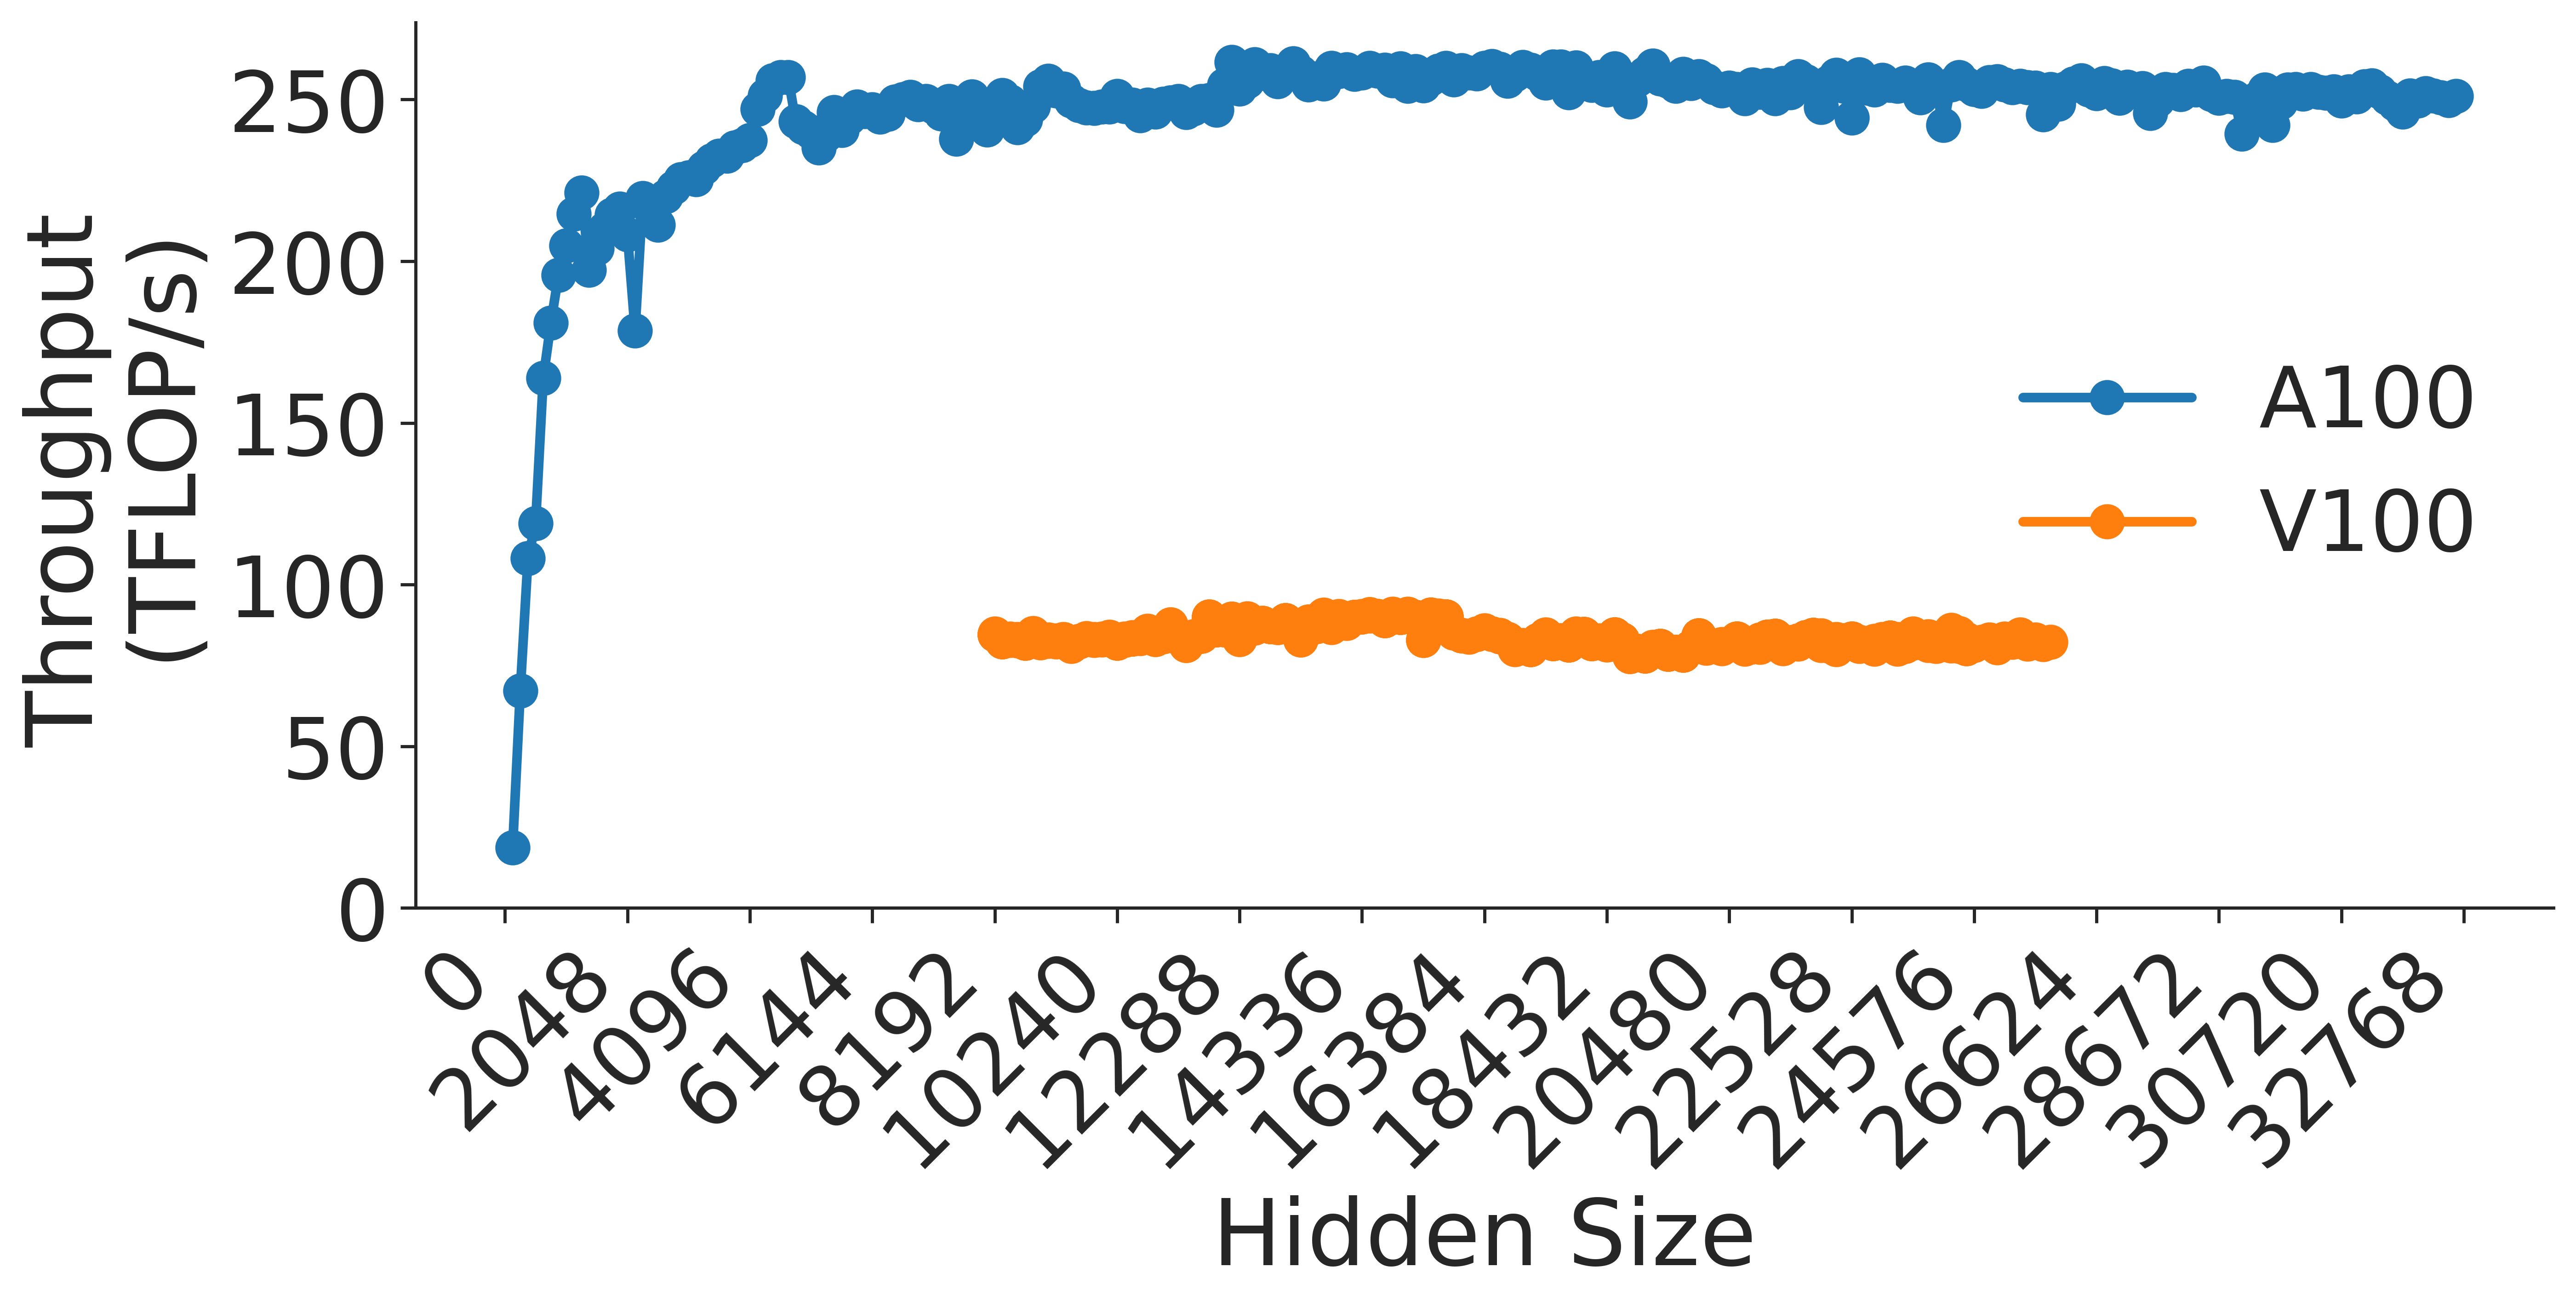
This image presents a line chart comparing the computational throughput (in TFLOP/s) of two GPU architectures (A100 and V100) across varying hidden sizes. The chart demonstrates performance scaling characteristics of these architectures in a computational task.
### Key Components
1. **Axes**
- **X-axis (Hidden Size)**:
- Range: 2048 to 32768
- Increment: Powers of 2 (2048, 4096, 6144, 8192, 10240, 12288, 14336, 16384, 18432, 20480, 22528, 24576, 26624, 28672, 30720, 32768)
- **Y-axis (Throughput (TFLOP/s))**:
- Range: 0 to 250
- Increment: 50
2. **Legend**
- Position: Right side of chart
- Color coding:
- Blue: A100
- Orange: V100
3. **Data Series**
- **A100 (Blue Line)**:
- Initial value: 10 TFLOP/s at 2048 hidden size
- Peak: 250 TFLOP/s at 4096 hidden size
- Plateau: Maintains ~250 TFLOP/s from 4096 to 32768
- **V100 (Orange Line)**:
- Initial value: 80 TFLOP/s at 10240 hidden size
- Plateau: Maintains ~80 TFLOP/s from 10240 to 30720
- Decline: Drops to 75 TFLOP/s at 32768
### Trend Analysis
1. **A100 Performance**
- Exhibits exponential growth pattern
- Achieves maximum throughput at 4096 hidden size
- Maintains peak performance across all larger hidden sizes
- Spatial grounding: Blue data points consistently align with legend
2. **V100 Performance**
- Flat performance curve across most hidden sizes
- Shows slight degradation at maximum hidden size (32768)
- Spatial grounding: Orange data points match legend color throughout
### Technical Observations
- A100 demonstrates superior scalability, achieving 250 TFLOP/s at 4096 hidden size
- V100 maintains consistent but lower performance (80 TFLOP/s) across tested range
- Both architectures show performance plateauing beyond certain hidden size thresholds
- No crossover points observed between A100 and V100 performance
## Data Points Table
| Hidden Size | A100 (TFLOP/s) | V100 (TFLOP/s) |
|-------------|----------------|----------------|
| 2048 | 10 | - |
| 4096 | 250 | - |
| 6144 | 250 | - |
| 8192 | 250 | - |
| 10240 | 250 | 80 |
| 12288 | 250 | 80 |
| 14336 | 250 | 80 |
| 16384 | 250 | 80 |
| 18432 | 250 | 80 |
| 20480 | 250 | 80 |
| 22528 | 250 | 80 |
| 24576 | 250 | 80 |
| 26624 | 250 | 80 |
| 28672 | 250 | 80 |
| 30720 | 250 | 80 |
| 32768 | 250 | 75 |
## Spatial Grounding Verification
- Legend position: Right side (confirmed)
- Color consistency:
- All blue points match A100 legend
- All orange points match V100 legend
- Axis alignment:
- X-axis values increase left-to-right
- Y-axis values increase bottom-to-top
## Trend Verification
1. A100 line shows:
- Steep upward slope from 2048→4096
- Horizontal plateau from 4096→32768
2. V100 line shows:
- Horizontal plateau from 10240→30720
- Slight downward slope at 32768
## Component Isolation
1. Header: Chart title (implied by axes)
2. Main Chart: Dual-line plot with data points
3. Footer: Legend and axis labels
## Language Analysis
- Primary language: English
- No non-English text detected
## Critical Findings
1. A100 achieves 25x higher throughput than V100 at 4096 hidden size
2. V100 maintains consistent performance across 20480→30720 range
3. Both architectures show performance saturation beyond specific hidden size thresholds
4. No performance degradation observed in A100 across full tested range