\n
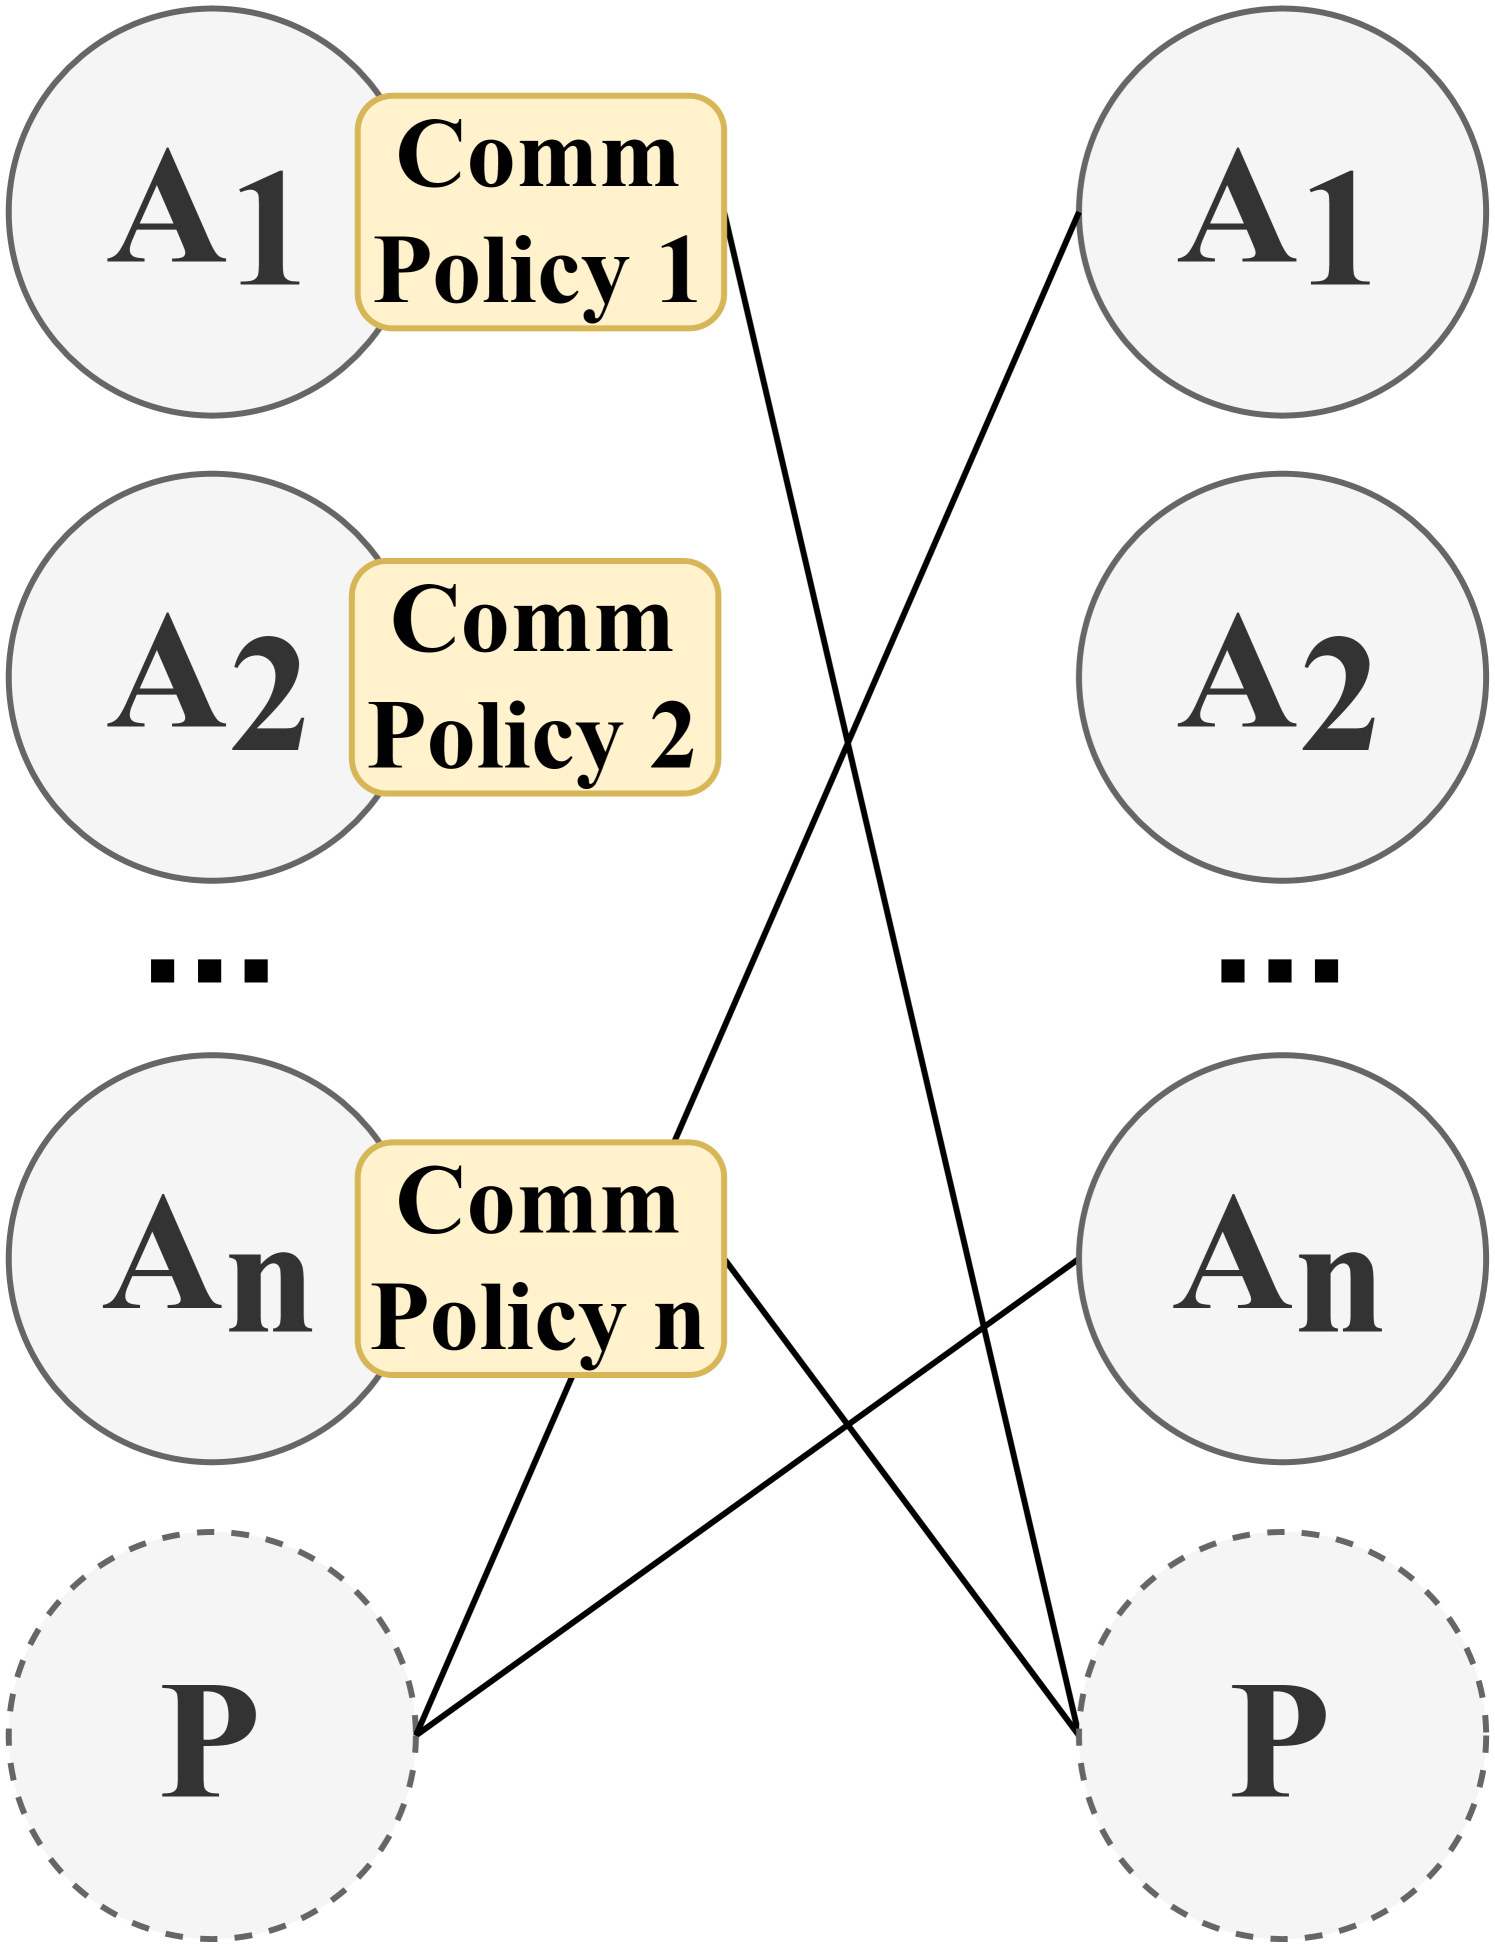
## Diagram: Communication Policy Distribution
### Overview
The image depicts a diagram illustrating the distribution of communication policies from multiple agents (A1 to An) to multiple parties (P). The diagram shows a many-to-many relationship between agents and parties, with each agent having a specific communication policy.
### Components/Axes
The diagram consists of the following components:
* **Agents (A1, A2, ..., An):** Represented by circles on the left side of the diagram. Each agent is labeled with "A" followed by a number (1 to n).
* **Communication Policies (Comm Policy 1, Comm Policy 2, ..., Comm Policy n):** Text labels within each agent's circle, indicating the specific communication policy associated with that agent.
* **Parties (P):** Represented by circles at the bottom of the diagram, enclosed in dashed grey circles.
* **Connections:** Solid black lines connecting each agent to each party, representing the distribution of the agent's communication policy to the party.
* **Ellipsis (...):** Indicates that the series of agents and parties continues beyond what is explicitly shown.
### Detailed Analysis or Content Details
The diagram shows a system where 'n' number of agents (A1 through An) each have a unique communication policy (Comm Policy 1 through Comm Policy n). Each agent distributes its communication policy to each of the parties (P). The diagram does not provide any numerical data or specific details about the policies themselves, only their existence and distribution.
* **Agent A1:** Has "Comm Policy 1".
* **Agent A2:** Has "Comm Policy 2".
* **Agent An:** Has "Comm Policy n".
* **Party P:** Receives communication policies from all agents (A1, A2, ..., An).
The connections between agents and parties are direct and uniform, suggesting that each party receives all communication policies from all agents.
### Key Observations
The diagram highlights a scenario where multiple agents each have a distinct communication policy, and all policies are distributed to all parties. This suggests a need for centralized policy awareness or a system for managing multiple policies at each party. The dashed circles around the "P" entities suggest they are a distinct group or a single entity represented multiple times.
### Interpretation
This diagram likely represents a system where different actors (agents) need to communicate with a set of recipients (parties) under different rules (communication policies). The fact that each party receives all policies suggests a need for the parties to be aware of all possible communication constraints. This could be a model for a secure communication system, a regulatory compliance framework, or a distributed system where different components have different access controls. The diagram doesn't provide information about *why* this distribution is necessary, but it clearly illustrates the structure of the communication flow. The use of "n" suggests a scalable system, capable of handling an arbitrary number of agents and parties. The diagram is conceptual and doesn't provide any quantitative data, but it effectively conveys the relationships between the components.