## Chart: Bitcoin/Dollar Price and RSI
### Overview
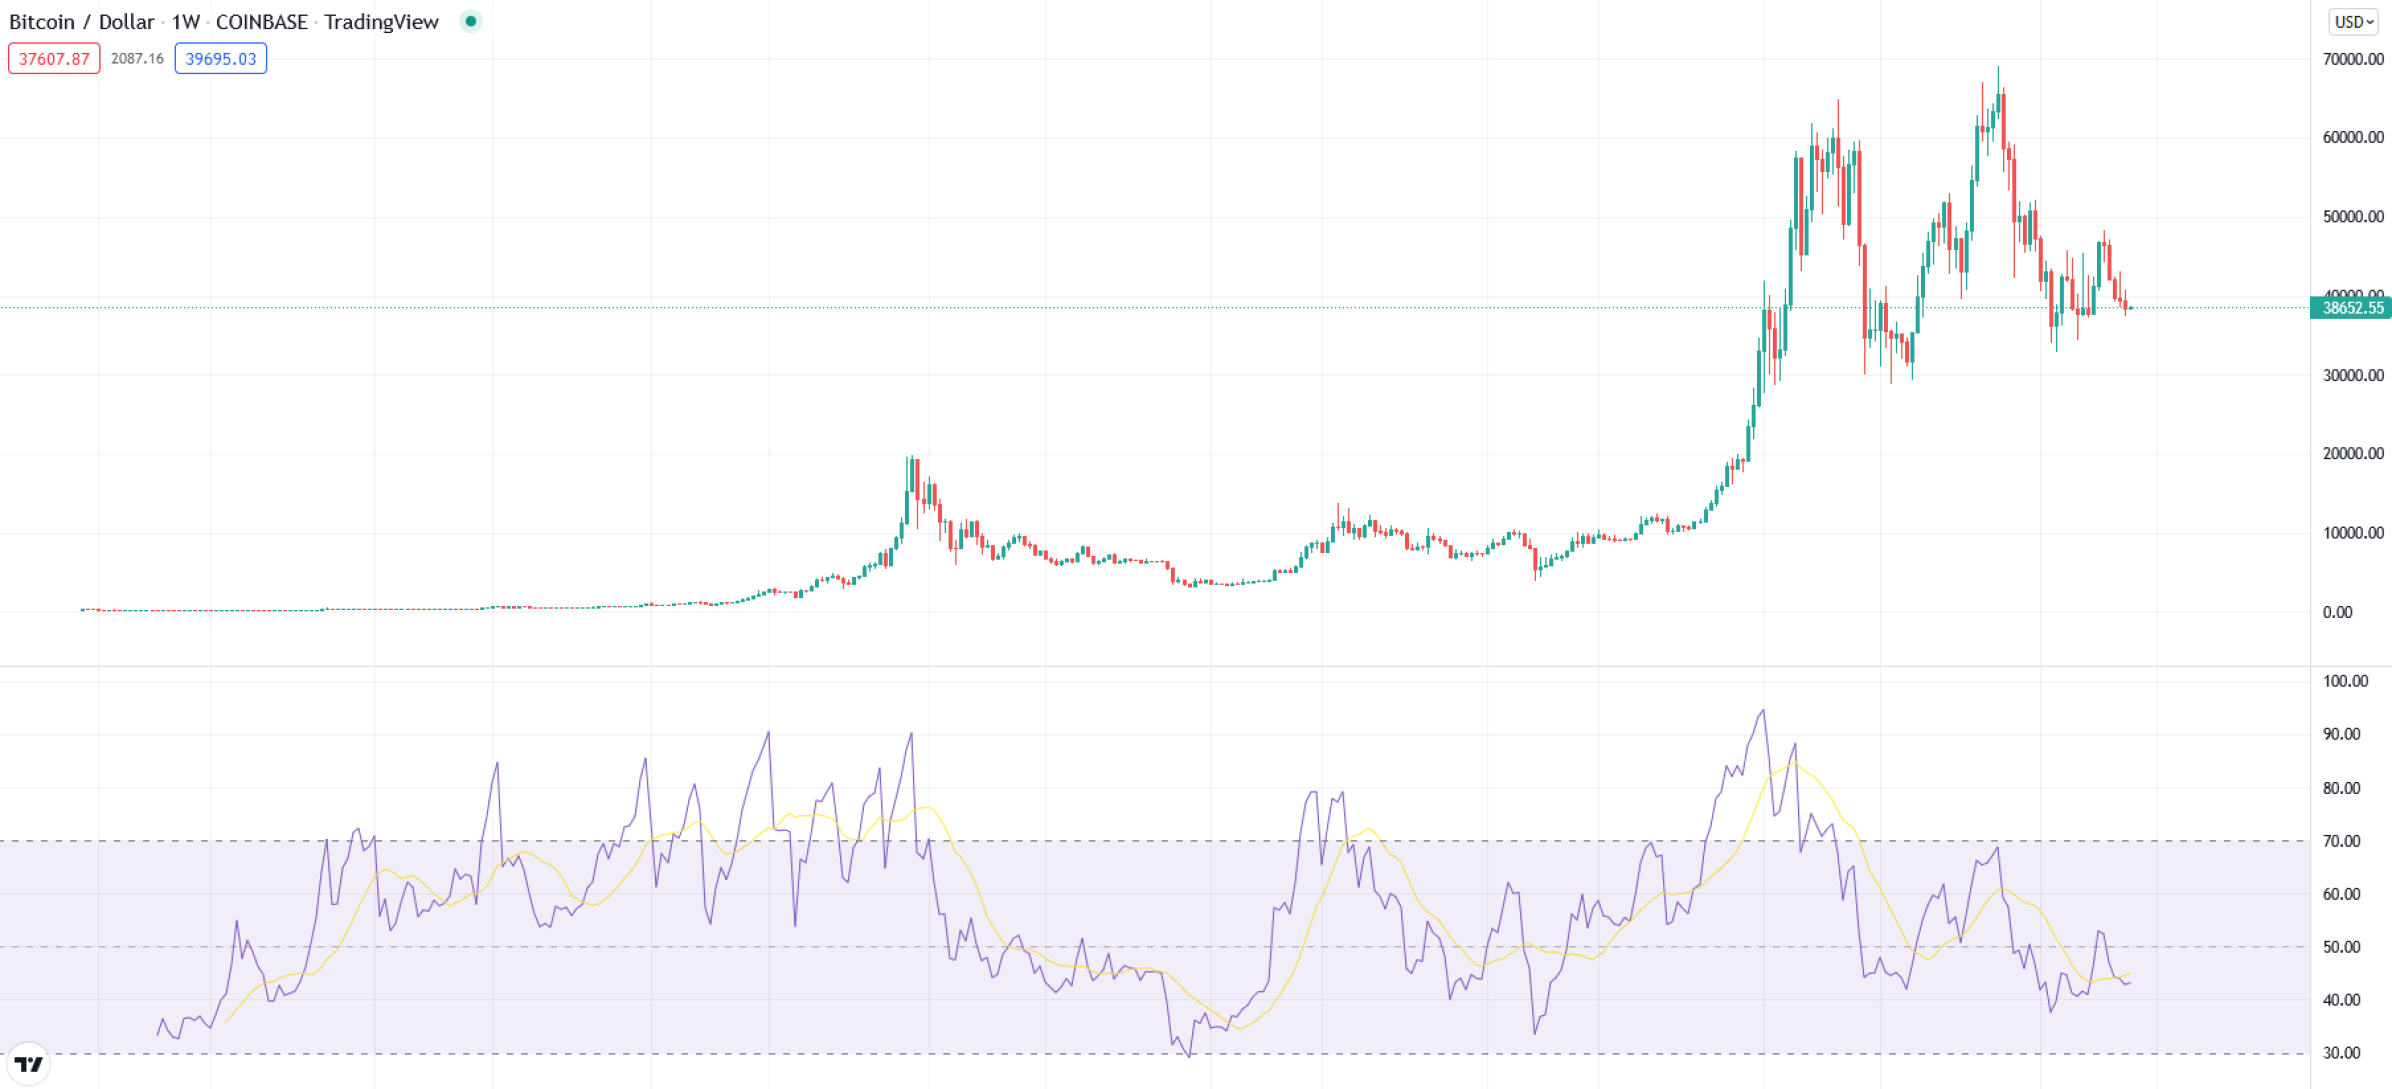
The image presents a chart of Bitcoin's price against the US Dollar (BTC/USD) along with its Relative Strength Index (RSI). The chart spans a significant period, showing price fluctuations and corresponding RSI values. The price chart uses candlestick representation, while the RSI is displayed as a line graph.
### Components/Axes
* **Title:** Bitcoin / Dollar 1W COINBASE TradingView
* **Y-Axis (Left):** Price in USD, ranging from 0.00 to 70000.00.
* **Y-Axis (Right):** RSI, ranging from 30.00 to 100.00.
* **X-Axis:** Time (unlabeled, but implied by the context of a price chart).
* **Price Data:** Candlestick chart showing the price of Bitcoin over time.
* **RSI Data:** Line graph showing the Relative Strength Index over time. A yellow moving average line is overlaid on the RSI.
* **Additional Values:**
* 37607.87
* 2087.16
* 39695.03
* 38652.55
### Detailed Analysis
**1. Price Chart (Candlestick):**
* **Trend:** The price of Bitcoin shows significant volatility. It starts at a relatively low value, experiences a major bull run, reaches a peak, and then undergoes a correction.
* **Values:**
* The current price is marked at approximately 38652.55 USD.
* Other values displayed are 37607.87, 2087.16, and 39695.03, which likely represent specific price points or calculations related to the chart.
**2. RSI Chart (Line Graph):**
* **Trend:** The RSI fluctuates between approximately 30 and 90, indicating periods of oversold and overbought conditions.
* **Moving Average:** A yellow moving average line smooths out the RSI fluctuations, providing a clearer view of the overall trend.
* **Levels:** The RSI oscillates, showing peaks and troughs that generally correlate with price movements.
### Key Observations
* **Price Peak:** The Bitcoin price reached a peak of approximately 60000-70000 USD before correcting.
* **RSI Correlation:** The RSI tends to be high when the price is rising rapidly and low when the price is falling.
* **Volatility:** Both the price and RSI exhibit significant volatility throughout the period shown.
### Interpretation
The chart illustrates the historical price action of Bitcoin and its corresponding RSI. The RSI is a momentum indicator used to identify overbought or oversold conditions. When the RSI is above 70, it suggests that Bitcoin is overbought and may be due for a correction. Conversely, when the RSI is below 30, it suggests that Bitcoin is oversold and may be due for a bounce.
The moving average on the RSI helps to filter out noise and identify the underlying trend. The chart suggests that Bitcoin has experienced significant price appreciation followed by a correction, and the RSI reflects these movements. The values displayed (37607.87, 2087.16, 39695.03, and 38652.55) likely represent specific price levels or calculations that are relevant to technical analysis of Bitcoin's price movements.