\n
## Chart: Bitcoin/Dollar (Weekly)
### Overview
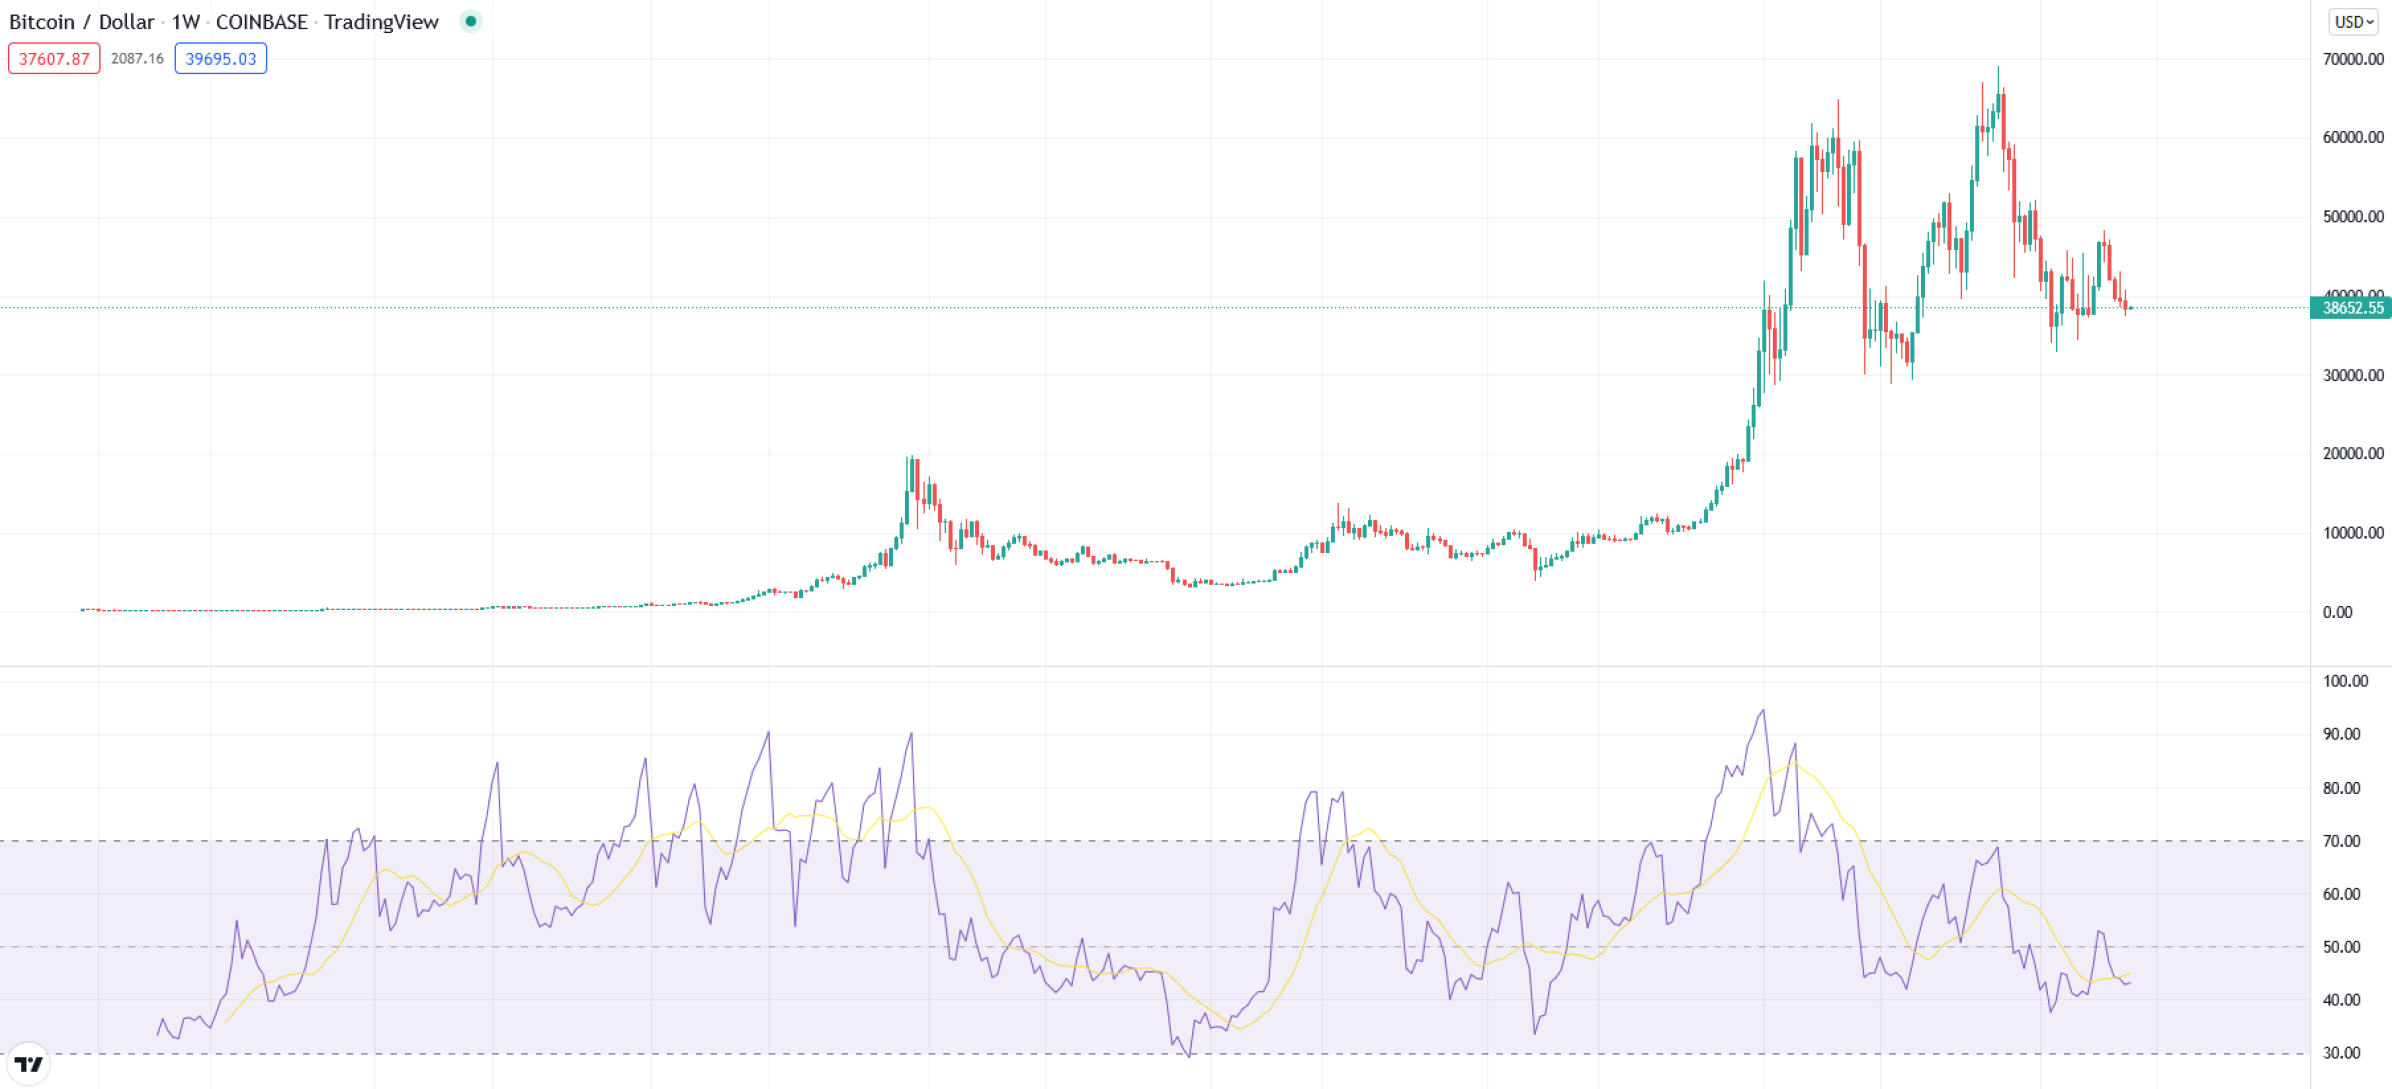
The image displays a weekly candlestick chart of the Bitcoin/Dollar exchange rate, along with two indicator lines below it. The chart spans a significant period, showing substantial price fluctuations over time. The top portion shows the price action, while the bottom portion displays two oscillating indicator lines.
### Components/Axes
* **Title:** Bitcoin / Dollar 1W COINBASE - TradingView
* **Y-axis (Price):** Ranges from 0.00 to 70000.00 (USD). The scale is linear.
* **X-axis (Time):** Represents weekly intervals. The exact dates are not visible, but the chart covers a long period.
* **Candlestick Chart:** Displays open, high, low, and close prices for each week.
* **Indicator 1 (Purple Line):** Oscillates between approximately 30.00 and 90.00.
* **Indicator 2 (Yellow Line):** Oscillates between approximately 40.00 and 70.00.
* **Top-Left Box:** Contains three numerical values: 37607.87, 2087.16, 39695.03. These likely represent current price, low, and high values respectively.
* **Horizontal Lines:** Several horizontal lines are present across the price chart, potentially indicating support or resistance levels.
### Detailed Analysis or Content Details
**Price Chart:**
The price chart shows a generally upward trend over the long term, with significant volatility.
* **Early Period (Left Side):** The price fluctuates between approximately 2,000 and 10,000 USD.
* **Mid-Period:** A substantial price increase occurs, reaching a peak of approximately 69,000 USD.
* **Recent Period (Right Side):** A significant price decline follows the peak, with the price currently around 38,682.55 USD.
* **Candlestick Patterns:** Numerous candlestick patterns are visible, indicating bullish and bearish sentiment at different times.
**Indicator 1 (Purple Line):**
* The purple line exhibits a cyclical pattern, oscillating between approximately 30 and 90.
* The line generally peaks and troughs in sync with major price movements.
* The line is currently around 50.
**Indicator 2 (Yellow Line):**
* The yellow line also exhibits a cyclical pattern, oscillating between approximately 40 and 70.
* The line shows a more muted oscillation compared to the purple line.
* The line is currently around 60.
**Numerical Values (Top-Left):**
* 37607.87: Likely the current Bitcoin price.
* 2087.16: Likely the lowest price observed.
* 39695.03: Likely the highest price observed.
### Key Observations
* **Strong Correlation:** The purple indicator line appears to have a stronger correlation with price movements than the yellow line.
* **Recent Downtrend:** The price has experienced a significant downtrend in the recent period, falling from a peak of around 69,000 USD to approximately 38,682.55 USD.
* **Volatility:** The chart demonstrates high volatility in the Bitcoin/Dollar exchange rate.
* **Indicator Divergence:** There are instances where the indicators diverge from the price action, potentially signaling a change in trend.
### Interpretation
The chart illustrates the historical price performance of Bitcoin against the US Dollar. The long-term trend is upward, but the price is subject to significant volatility. The indicators (purple and yellow lines) are likely momentum oscillators, designed to identify overbought and oversold conditions. The purple line's stronger correlation with price suggests it may be a more reliable indicator. The recent downtrend, coupled with the current indicator values, could suggest a potential for further price declines, but this is not definitive. The horizontal lines on the chart likely represent key support and resistance levels that traders monitor. The top-left box provides a snapshot of the current price and recent price range.
The chart provides a visual representation of the risk and reward associated with investing in Bitcoin. The potential for high returns is evident in the price increase from the early period to the peak, but the recent decline highlights the inherent risks. The indicators can be used to help identify potential entry and exit points, but they are not foolproof.