## Candlestick Chart: Bitcoin/Dollar (1W) TradingView
### Overview
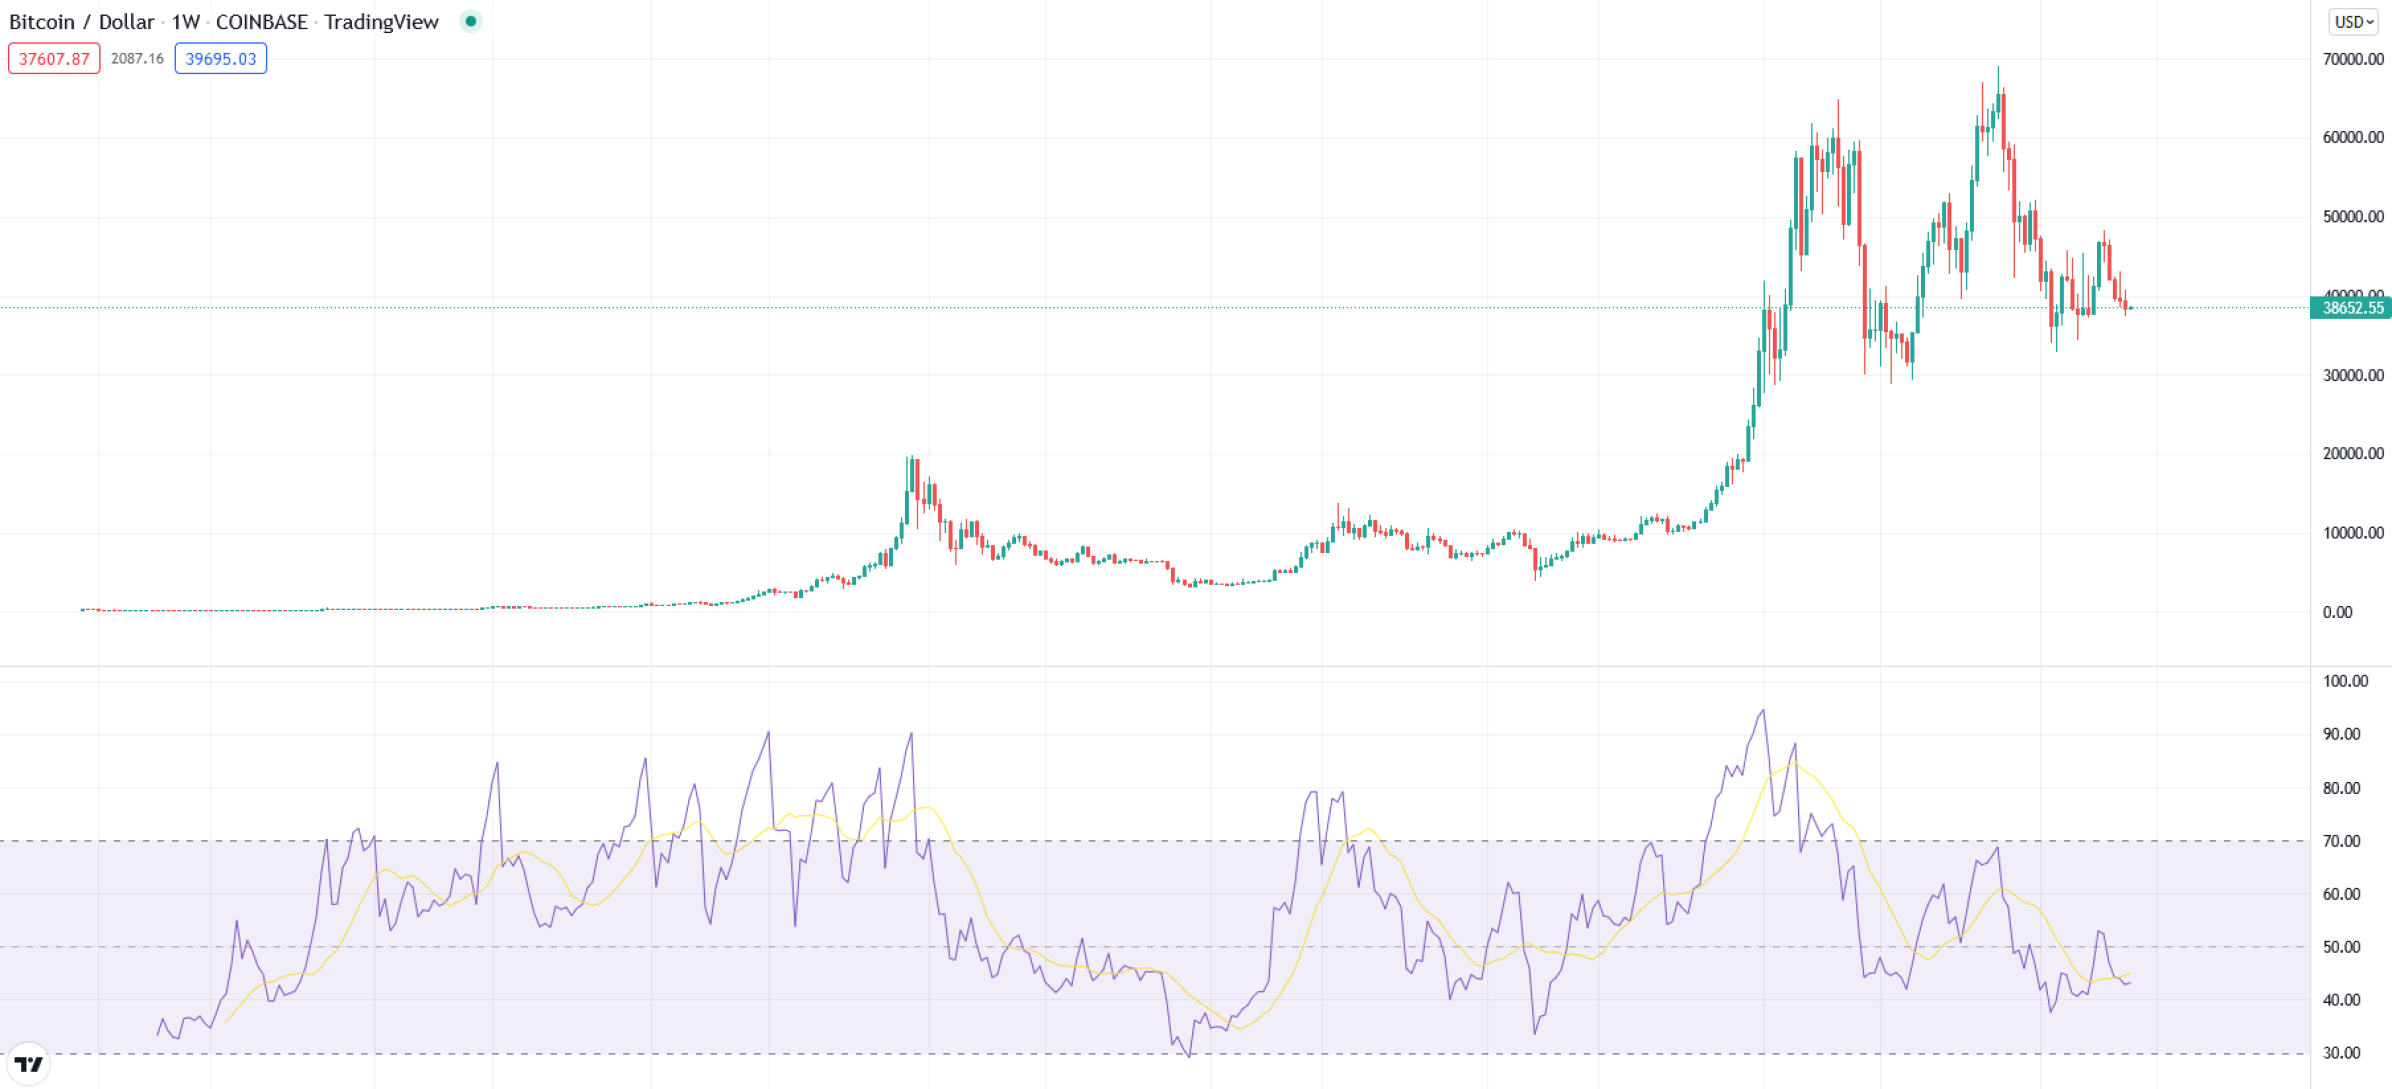
The image displays a Bitcoin/Dollar (BTC/USD) 1-week candlestick chart from COINBASE TradingView. The chart shows price movements over time with green (upward) and red (downward) candlesticks, accompanied by two moving average lines (purple and yellow) and a price axis on the right. A horizontal dotted line at ~$38,652.55 is visible, likely indicating a key support/resistance level.
---
### Components/Axes
1. **X-Axis (Time)**:
- Labeled "1W" (1 Week) in the top-left corner.
- No explicit date markers, but candlesticks represent sequential time intervals.
2. **Y-Axis (Price)**:
- Right-axis labeled "USD" with values ranging from $0.00 to $70,000.00 in increments of $10,000.
- Left-axis shows price markers at $10,000, $20,000, ..., $70,000.
3. **Legend**:
- Located in the bottom-right corner.
- **Purple line**: 200-period Simple Moving Average (SMA).
- **Yellow line**: 50-period Simple Moving Average (SMA).
4. **Additional Elements**:
- Horizontal dotted line at ~$38,652.55 (bottom of the chart).
- Timestamp in the bottom-left corner: "TV" (likely TradingView branding).
---
### Detailed Analysis
1. **Candlestick Trends**:
- **Early Period (Left Side)**:
- Price remains flat near $37,607.87 (red candlestick at the far left).
- Gradual upward movement to ~$39,695.03 (green candlesticks).
- **Mid-Period**:
- Volatile price action with alternating green/red candlesticks.
- Price peaks near $40,000, then declines to ~$38,652.55.
- **Late Period (Right Side)**:
- Sharp upward surge to ~$65,000 (green candlesticks dominate).
- Subsequent correction to ~$50,000 (red candlesticks).
2. **Moving Averages**:
- **Purple (200 SMA)**:
- Starts near $37,607.87, trends upward to ~$40,000, then declines to ~$38,652.55.
- **Yellow (50 SMA)**:
- Begins at ~$37,607.87, rises to ~$40,000, dips to ~$38,652.55, then surges to ~$60,000 before correcting.
3. **Key Data Points**:
- **High**: ~$65,000 (right side, green candlesticks).
- **Low**: ~$37,607.87 (left side, red candlestick).
- **Support Level**: Horizontal dotted line at ~$38,652.55.
---
### Key Observations
1. **SMA Crossover**:
- The 50 SMA (yellow) crosses above the 200 SMA (purple) near $39,695.03, signaling a potential bullish trend.
- Later, the 50 SMA crosses below the 200 SMA during the price drop to ~$38,652.55, indicating bearish momentum.
2. **Volatility**:
- Sharp price swings observed between $38,652.55 and $65,000, with candlestick wicks extending beyond these levels.
3. **Support/Resistance**:
- The horizontal dotted line at ~$38,652.55 acts as a critical support level, with price repeatedly testing it during the mid-period.
---
### Interpretation
1. **Trend Analysis**:
- The initial flat price near $37,607.87 suggests consolidation.
- The 50/200 SMA crossover near $39,695.03 marks a bullish breakout, followed by a correction to the support level.
- The late-period surge to $65,000 reflects strong buying pressure, but the subsequent drop to ~$50,000 indicates profit-taking or market correction.
2. **Market Dynamics**:
- The support level at ~$38,652.55 appears robust, as price bounces off it multiple times.
- The divergence between the 50 SMA (yellow) and price action suggests potential for renewed upward momentum if the 50 SMA stabilizes above the 200 SMA.
3. **Anomalies**:
- The extreme volatility between $38,652.55 and $65,000 may reflect external factors (e.g., regulatory news, macroeconomic events) not visible in the chart.
---
### Conclusion
The chart illustrates Bitcoin's price volatility over a 1-week period, with key technical indicators (SMAs) and support levels providing insights into market sentiment. The 50/200 SMA crossover and repeated tests of the $38,652.55 support level highlight critical decision points for traders. The late-period surge to $65,000 underscores Bitcoin's susceptibility to rapid price swings, emphasizing the importance of risk management in cryptocurrency trading.