## Heatmaps: Model/Dataset Category Performance
### Overview
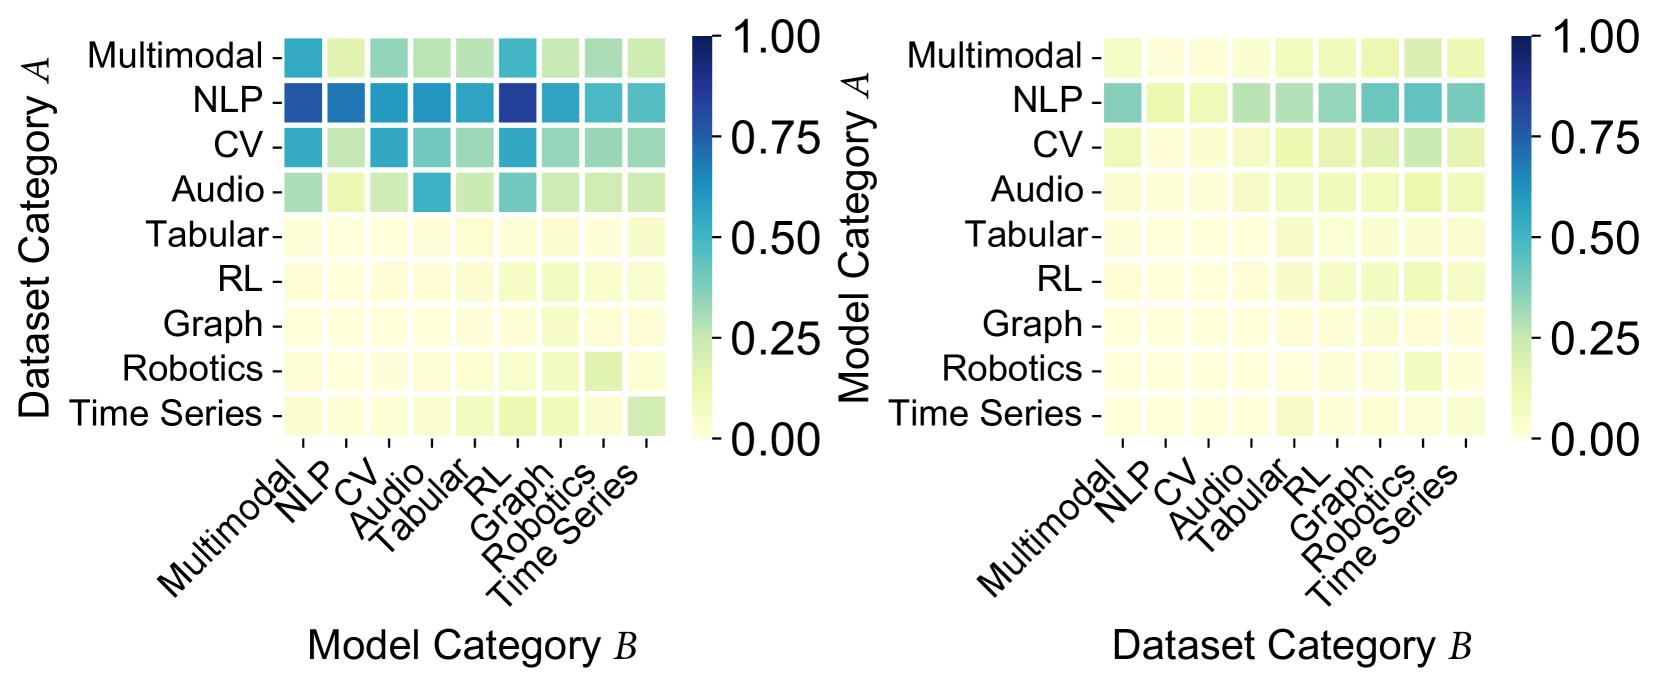
The image presents two heatmaps comparing the performance of different model and dataset categories. The left heatmap shows the performance of models (Model Category B) on different datasets (Dataset Category A), while the right heatmap shows the performance of datasets (Dataset Category B) when used with different models (Model Category A). The color intensity represents the performance score, ranging from 0.00 (yellow) to 1.00 (dark blue).
### Components/Axes
**Left Heatmap:**
* **Y-axis (Dataset Category A):**
* Multimodal
* NLP
* CV
* Audio
* Tabular
* RL
* Graph
* Robotics
* Time Series
* **X-axis (Model Category B):**
* Multimodal
* NLP
* CV
* Audio
* Tabular
* RL
* Graph
* Robotics
* Time Series
* **Color Scale:** Ranges from 0.00 (yellow) to 1.00 (dark blue), with increments of 0.25.
**Right Heatmap:**
* **Y-axis (Model Category A):**
* Multimodal
* NLP
* CV
* Audio
* Tabular
* RL
* Graph
* Robotics
* Time Series
* **X-axis (Dataset Category B):**
* Multimodal
* NLP
* CV
* Audio
* Tabular
* RL
* Graph
* Robotics
* Time Series
* **Color Scale:** Ranges from 0.00 (yellow) to 1.00 (dark blue), with increments of 0.25.
### Detailed Analysis
**Left Heatmap (Model Category B vs. Dataset Category A):**
* **Multimodal Models:** Perform relatively well (around 0.50) on Multimodal, NLP, and CV datasets.
* **NLP Models:** Show high performance (0.75-1.00) on NLP datasets, and moderate performance (0.50-0.75) on Multimodal, CV, and Audio datasets.
* **CV Models:** Perform moderately well (0.50-0.75) on CV datasets, and lower on others.
* **Audio Models:** Show moderate performance (around 0.50) on Audio datasets.
* **Tabular, RL, Graph, Robotics, and Time Series Models:** Generally show low performance (close to 0.00-0.25) across most datasets.
* **Specific Data Points:**
* NLP Model on NLP Dataset: ~0.90 (dark blue)
* CV Model on CV Dataset: ~0.60 (light blue)
* Time Series Model on Time Series Dataset: ~0.20 (yellow)
**Right Heatmap (Dataset Category B vs. Model Category A):**
* **Multimodal Datasets:** Show low performance (close to 0.00-0.25) across most models.
* **NLP Datasets:** Perform moderately well (0.50-0.75) with NLP, CV, Audio, Tabular, and RL models.
* **CV Datasets:** Show low performance (close to 0.00-0.25) across most models.
* **Audio Datasets:** Show low performance (close to 0.00-0.25) across most models.
* **Tabular Datasets:** Show low performance (close to 0.00-0.25) across most models.
* **RL Datasets:** Show low performance (close to 0.00-0.25) across most models.
* **Graph Datasets:** Show low performance (close to 0.00-0.25) across most models.
* **Robotics Datasets:** Show low performance (close to 0.00-0.25) across most models.
* **Time Series Datasets:** Show low performance (close to 0.00-0.25) across most models.
* **Specific Data Points:**
* NLP Dataset with NLP Model: ~0.70 (light blue)
* CV Dataset with CV Model: ~0.20 (yellow)
### Key Observations
* The left heatmap shows that NLP models perform well on NLP datasets, and CV models perform moderately well on CV datasets.
* The right heatmap shows that NLP datasets perform moderately well across a range of models.
* Other model/dataset combinations generally show low performance.
* There is a clear diagonal trend in the left heatmap, indicating that models tend to perform best on datasets of the same category.
### Interpretation
The heatmaps suggest that certain model categories are better suited for specific dataset categories. NLP models excel on NLP datasets, and CV models show reasonable performance on CV datasets. The right heatmap indicates that NLP datasets are more versatile and can be used with a wider range of models. The low performance of other model/dataset combinations suggests that these models may not be well-suited for these datasets, or that further optimization is needed. The diagonal trend in the left heatmap highlights the importance of matching model and dataset categories for optimal performance.