## Heatmap: Model-Dataset Category Performance Comparison
### Overview
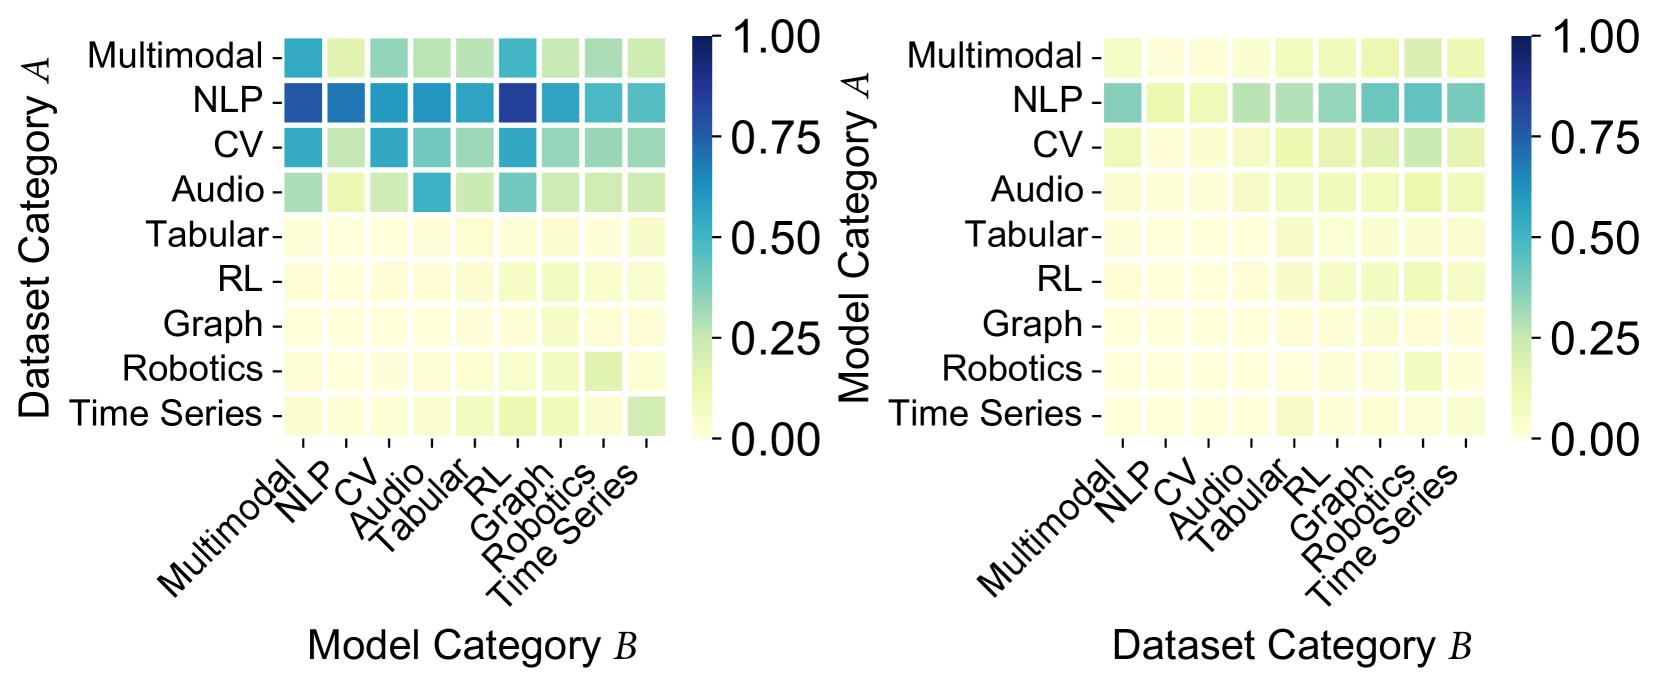
The image contains two side-by-side heatmaps comparing performance metrics between dataset categories (A/B) and model categories (A/B). Each matrix uses a color gradient from yellow (0.00) to dark blue (1.00) to represent performance scores. The left matrix compares Dataset Category A with Model Category B, while the right matrix compares Dataset Category B with Model Category B.
### Components/Axes
**Left Matrix (Dataset A vs Model B):**
- **Y-axis (Dataset Category A):** Multimodal, NLP, CV, Audio, Tabular, RL, Graph, Robotics, Time Series
- **X-axis (Model Category B):** Multimodal, NLP, CV, Audio, Tabular, RL, Graph, Robotics, Time Series
- **Color Legend:** Right side, gradient from yellow (0.00) to dark blue (1.00)
**Right Matrix (Dataset B vs Model B):**
- **Y-axis (Dataset Category B):** Same categories as left matrix
- **X-axis (Model Category B):** Same categories as left matrix
- **Color Legend:** Identical to left matrix
### Detailed Analysis
**Left Matrix (Dataset A):**
- **NLP Models:** Highest performance (dark blue) with NLP datasets (0.95-1.00)
- **Multimodal Models:** Strong performance with NLP (0.85) and CV (0.75) datasets
- **CV Models:** Best with CV datasets (0.80) and NLP (0.70)
- **Robotics Models:** Moderate performance with Robotics datasets (0.60)
- **Time Series Models:** Low performance (0.40-0.50) across most datasets
**Right Matrix (Dataset B):**
- **NLP Models:** Still highest with NLP datasets (0.75-0.85)
- **Multimodal Models:** Reduced performance (0.60-0.70) compared to left matrix
- **CV Models:** Lower scores (0.50-0.60) across all datasets
- **Robotics Models:** Slight improvement (0.50) with Robotics datasets
- **Time Series Models:** Minimal improvement (0.30-0.40)
### Key Observations
1. **NLP Dominance:** NLP models consistently show highest performance with NLP datasets in both matrices
2. **Performance Decline:** Right matrix shows 20-30% lower scores across all categories compared to left matrix
3. **Multimodal Strength:** Multimodal models perform best with NLP datasets in both matrices
4. **Robotics/Time Series:** Both categories show weak performance in Dataset B matrix
5. **Color Gradient:** Dark blue (high values) concentrated in NLP-related cells, yellow (low values) in Robotics/Time Series
### Interpretation
The heatmaps demonstrate strong model-dataset alignment for NLP tasks, with NLP models achieving near-perfect scores (0.95-1.00) when paired with NLP datasets. The significant performance drop in Dataset B matrix suggests either:
1. Different data characteristics in Dataset B
2. More challenging evaluation metrics
3. Dataset B containing more complex or noisy data
Notably, Multimodal models show consistent performance across both matrices, indicating robustness to dataset variations. The weak performance of Robotics and Time Series models across most datasets suggests these categories may require specialized architectures or additional feature engineering.
The color gradient visualization effectively highlights the importance of matching model architecture to dataset type, with NLP being the most performant combination. The 20-30% performance gap between matrices emphasizes the critical role of dataset quality and characteristics in model effectiveness.