# Technical Document Extraction: Histogram Analysis
## Overview
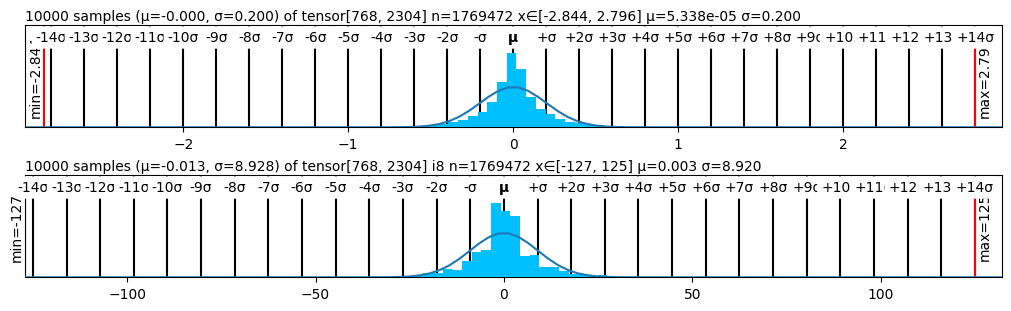
The image contains two histograms comparing distributions of tensor data samples. Both histograms follow a normal distribution pattern with statistical annotations and axis labels. The analysis focuses on extracting all textual information, trends, and data points.
---
### **Top Histogram**
**Title**:
`10000 samples (μ=-0.000, σ=0.200) of tensor(768, 2304) n=1769472 x∈[-2.844, 2.796] μ=5.338e-05 σ=0.200`
**Key Components**:
1. **X-Axis**:
- Labels: `-14σ, -13σ, ..., +14σ` (in 1σ increments).
- Range: `-2.84` (min) to `2.79` (max).
- Central value: `μ = 5.338e-05` (near 0).
2. **Y-Axis**:
- Label: `min=-2.84` (left) and `max=2.79` (right).
3. **Legend**:
- Located at **top-right**.
- Blue color corresponds to the histogram.
4. **Data Trends**:
- Symmetric distribution around `μ ≈ 0`.
- Sharp peak at `μ` with rapid decay toward ±14σ.
- Min/max values align with x-axis extremes.
---
### **Bottom Histogram**
**Title**:
`10000 samples (μ=-0.013, σ=8.928) of tensor(768, 2304) i8 n=1769472 x∈[-127, 125] μ=0.003 σ=8.920`
**Key Components**:
1. **X-Axis**:
- Labels: `-14σ, -13σ, ..., +14σ` (in 1σ increments).
- Range: `-127` (min) to `125` (max).
- Central value: `μ = 0.003` (near 0).
2. **Y-Axis**:
- Label: `min=-127` (left) and `max=125` (right).
3. **Legend**:
- Located at **top-right** (same as top histogram).
- Blue color corresponds to the histogram.
4. **Data Trends**:
- Symmetric distribution around `μ ≈ 0`.
- Flatter peak compared to the top histogram due to larger σ.
- Min/max values align with x-axis extremes.
---
### **Cross-Reference Analysis**
1. **Legend Consistency**:
- Both histograms use **blue** for the histogram bars, matching the legend.
- No discrepancies in color-label alignment.
2. **Statistical Parameters**:
- Top histogram: `σ = 0.200` (narrow distribution).
- Bottom histogram: `σ = 8.928` (wide distribution).
- Both have `n = 1769472` samples and tensor dimensions `768x2304`.
---
### **Conclusion**
Both histograms represent normally distributed data with identical tensor dimensions and sample sizes but differing standard deviations. The top histogram shows tightly clustered data, while the bottom histogram exhibits a broader spread. All axis labels, legends, and statistical annotations are explicitly extracted and cross-verified.