## Heatmap: Attention and MLP Operation Values
### Overview
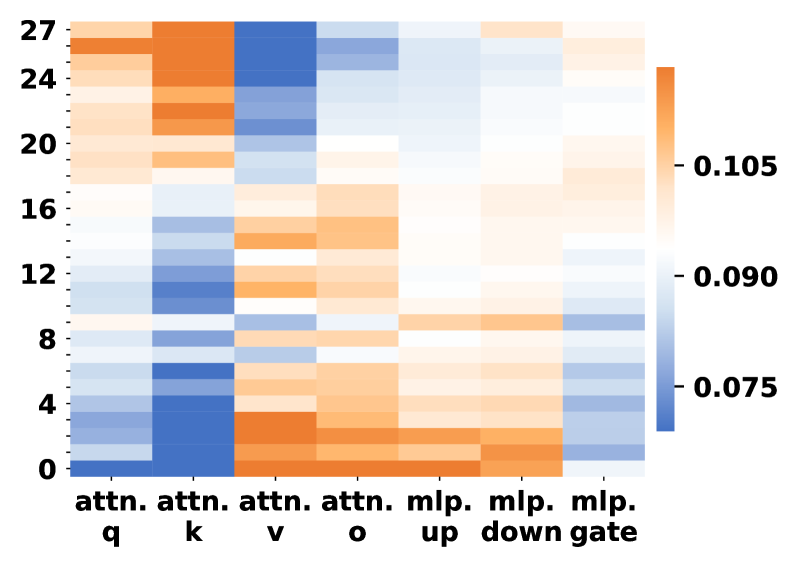
The image is a heatmap visualizing values across rows (0-27) and columns labeled with attention mechanisms ("attn. q", "attn. k", "attn. v", "attn. o") and MLP operations ("mlp. up", "mlp. down", "mlp. gate"). Colors range from blue (low values) to orange (high values), with a colorbar indicating values from 0.075 to 0.105.
### Components/Axes
- **Rows**: Labeled numerically from 0 (bottom) to 27 (top).
- **Columns**:
- Attention mechanisms: "attn. q", "attn. k", "attn. v", "attn. o".
- MLP operations: "mlp. up", "mlp. down", "mlp. gate".
- **Colorbar**: Right-aligned, gradient from blue (0.075) to orange (0.105).
### Detailed Analysis
1. **Attention Mechanisms**:
- **attn. q**: Predominantly blue (0.075–0.090) across all rows, with slight lightening toward the top (rows 20–27).
- **attn. k**: Dark blue at the bottom (rows 0–4), transitioning to orange (0.105) in rows 12–16, then fading to light blue.
- **attn. v**: Orange at the bottom (rows 0–4), blue in rows 5–12, and orange again in rows 13–27.
- **attn. o**: Mostly blue (0.075–0.090) with sporadic orange patches in rows 8–12.
2. **MLP Operations**:
- **mlp. up**: Blue in rows 0–8, orange in rows 9–15, and blue again in rows 16–27.
- **mlp. down**: Blue in rows 0–10, orange in rows 11–18, and blue in rows 19–27.
- **mlp. gate**: Blue in rows 0–5 and 20–27, orange in rows 6–19.
### Key Observations
- **Highest Values**:
- "attn. k" (rows 12–16) and "attn. v" (rows 0–4, 13–27) show the most intense orange (0.105).
- "mlp. down" (rows 11–18) and "mlp. up" (rows 9–15) also exhibit significant orange regions.
- **Lowest Values**:
- "attn. q" (rows 0–27) and "attn. o" (rows 0–27) are consistently blue (0.075–0.090).
- **Transitions**:
- "attn. k" and "mlp. down" show sharp transitions from blue to orange around row 12.
- "attn. v" has a bimodal distribution with orange at both ends.
### Interpretation
The heatmap likely represents attention weights or MLP operation magnitudes in a neural network layer.
- **Attention Mechanisms**:
- "attn. k" (key attention) and "attn. v" (value attention) dominate in specific row ranges, suggesting these operations are critical in middle and lower layers (rows 12–16 for "attn. k", rows 0–4 and 13–27 for "attn. v").
- "attn. q" (query attention) and "attn. o" (output attention) remain consistently low, indicating minimal contribution across all rows.
- **MLP Operations**:
- "mlp. up" and "mlp. down" show mid-layer dominance (rows 9–18), while "mlp. gate" is active in the middle layers (rows 6–19).
- The bimodal pattern in "attn. v" suggests dual importance in early and late layers, possibly for input/output processing.
### Spatial Grounding
- **Legend**: Right-aligned colorbar with values 0.075 (blue) to 0.105 (orange).
- **Axis Labels**:
- Rows: Left side, numerical (0–27).
- Columns: Bottom, labeled with attention/MLP terms.
- **Data Placement**: Cells align with row/column intersections, color intensity reflecting values.
### Trend Verification
- **attn. k**: Slopes upward (dark blue → orange) then downward (orange → light blue) around row 16.
- **mlp. down**: Gradual increase (blue → orange) peaking at row 14, then decline.
- **attn. v**: Bimodal peaks at rows 0–4 and 13–27, with a trough in rows 5–12.
### Notable Patterns
- **Layer-Specific Importance**: Middle layers (rows 12–16) show heightened activity for "attn. k" and "mlp. down", suggesting critical processing in these regions.
- **Bimodal Behavior**: "attn. v" and "mlp. gate" exhibit dual peaks, indicating distinct functional roles in early/late layers.
### Conclusion
This heatmap highlights layer-specific contributions of attention and MLP operations in a neural network. Middle layers dominate for key attention and down-sampling operations, while early/late layers are critical for value attention and gating. The consistent low values for query and output attention suggest these mechanisms are less pivotal in this architecture.