TECHNICAL ASSET FINGERPRINT
c2bc8df2f76ecbe62239b742
Click to view fullscreen
Press ESC or click to close
FOUND IN PAPERS
EXPERT: healer-alpha-free VERSION 1
RUNTIME: free/openrouter/healer-alpha
INTEL_VERIFIED
\n
## Line Charts: I-Don't-Know Rate vs. Layer for Mistral-7B Models
### Overview
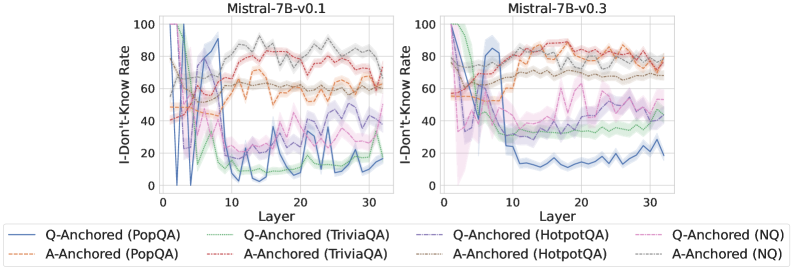
The image displays two side-by-side line charts comparing the "I-Don't-Know Rate" across the 32 layers (0-31) of two versions of the Mistral-7B language model: v0.1 (left) and v0.3 (right). Each chart plots eight data series, representing two anchoring methods (Q-Anchored and A-Anchored) applied to four different question-answering datasets (PopQA, TriviaQA, HotpotQA, NQ). The charts visualize how the model's propensity to output "I don't know" changes through its layers for different evaluation setups.
### Components/Axes
* **Titles:**
* Left Chart: `Mistral-7B-v0.1`
* Right Chart: `Mistral-7B-v0.3`
* **X-Axis (Both Charts):**
* Label: `Layer`
* Scale: Linear, from 0 to 30, with major ticks at 0, 10, 20, 30. The data appears to cover layers 0 through 31.
* **Y-Axis (Both Charts):**
* Label: `I-Don't-Know Rate`
* Scale: Linear, from 0 to 100, with major ticks at 0, 20, 40, 60, 80, 100.
* **Legend (Bottom, spanning both charts):**
* The legend is positioned below the two chart panels.
* It defines eight series using a combination of color and line style (solid vs. dashed).
* **Q-Anchored Series (Solid Lines):**
* Blue solid: `Q-Anchored (PopQA)`
* Green solid: `Q-Anchored (TriviaQA)`
* Purple solid: `Q-Anchored (HotpotQA)`
* Pink solid: `Q-Anchored (NQ)`
* **A-Anchored Series (Dashed Lines):**
* Orange dashed: `A-Anchored (PopQA)`
* Red dashed: `A-Anchored (TriviaQA)`
* Brown dashed: `A-Anchored (HotpotQA)`
* Gray dashed: `A-Anchored (NQ)`
### Detailed Analysis
**Chart 1: Mistral-7B-v0.1 (Left Panel)**
* **Q-Anchored (Solid Lines) Trend:** All four solid lines exhibit a similar, dramatic pattern. They start at a very high I-Don't-Know Rate (near 100% for PopQA/HotpotQA, ~80% for TriviaQA/NQ) in the earliest layers (0-2). They then plummet sharply within the first 5-7 layers to rates between 10% and 40%. After this initial drop, they fluctuate significantly in the middle and later layers (10-31), with no single clear trend, oscillating roughly between 5% and 50%.
* **A-Anchored (Dashed Lines) Trend:** The dashed lines show more varied and generally higher rates than their Q-Anchored counterparts after the initial layers.
* `A-Anchored (PopQA)` (Orange dashed): Starts around 40%, rises to ~60% by layer 10, and remains relatively stable between 55-65% for the rest of the layers.
* `A-Anchored (TriviaQA)` (Red dashed): Starts high (~80%), dips slightly, then climbs to the highest sustained rate on the chart, fluctuating between 70-90% from layer 10 onward.
* `A-Anchored (HotpotQA)` (Brown dashed): Starts around 60%, shows a gradual upward trend, ending near 70-75%.
* `A-Anchored (NQ)` (Gray dashed): Starts around 50%, rises to ~70% by layer 10, and stays in the 65-75% range.
**Chart 2: Mistral-7B-v0.3 (Right Panel)**
* **Q-Anchored (Solid Lines) Trend:** The pattern is notably different from v0.1. The initial drop is less severe for some datasets.
* `Q-Anchored (PopQA)` (Blue solid): Still shows a sharp drop from ~100% to ~20% within the first 10 layers, then stabilizes at a low rate (10-25%).
* `Q-Anchored (TriviaQA)` (Green solid): Drops from ~80% to ~40% by layer 10 and remains in the 30-45% band.
* `Q-Anchored (HotpotQA)` (Purple solid): Drops from ~90% to ~50% by layer 10, then fluctuates between 40-60%.
* `Q-Anchored (NQ)` (Pink solid): Drops from ~70% to ~40% by layer 10, then fluctuates between 30-50%.
* **A-Anchored (Dashed Lines) Trend:** These lines are more tightly clustered and stable compared to v0.1.
* All four dashed lines (Orange, Red, Brown, Gray) converge into a band between approximately 60% and 85% after layer 10.
* `A-Anchored (TriviaQA)` (Red dashed) and `A-Anchored (PopQA)` (Orange dashed) are generally at the top of this band (70-85%).
* `A-Anchored (HotpotQA)` (Brown dashed) and `A-Anchored (NQ)` (Gray dashed) are slightly lower (60-75%).
### Key Observations
1. **Anchoring Method Effect:** Across both model versions, the **A-Anchored** evaluation (dashed lines) consistently results in a higher I-Don't-Know Rate in the middle and later layers compared to the **Q-Anchored** evaluation (solid lines) for the same dataset.
2. **Model Version Difference:** The transition from v0.1 to v0.3 shows a clear change in behavior. In v0.3, the Q-Anchored rates stabilize at higher levels for most datasets (except PopQA), and the A-Anchored rates become more uniform and clustered.
3. **Dataset Sensitivity:** The PopQA dataset (blue/orange) often shows the most extreme behavior—the highest starting point and the lowest stabilized point for Q-Anchored, and a strong rise for A-Anchored. TriviaQA (green/red) tends to have the highest sustained A-Anchored rates.
4. **Layer Sensitivity:** The most significant changes in rate occur in the first 10 layers. Layers beyond 10 show more stable, though still fluctuating, behavior.
### Interpretation
These charts investigate how a large language model's internal representations evolve across its layers, specifically regarding its uncertainty or refusal to answer ("I don't know"). The "anchoring" likely refers to what part of the prompt the model's internal state is measured on—the question (Q) or the answer (A).
* **The Core Finding:** The stark difference between Q-Anchored and A-Anchored lines suggests that the model's internal "certainty" is highly dependent on the context it is given. When probed based on the question alone (Q-Anchored), the model's uncertainty drops rapidly in early layers, indicating it quickly forms a potential answer pathway. However, when probed based on a provided answer (A-Anchored), uncertainty remains high, suggesting the model maintains a critical or verifying stance towards supplied information.
* **Evolution from v0.1 to v0.3:** The changes in v0.3 imply a shift in the model's internal processing. The higher stabilized Q-Anchored rates (for datasets other than PopQA) might indicate the updated model is more conservative or less confident in its internal answer representations. The convergence of A-Anchored rates suggests a more uniform verification mechanism across different knowledge domains in the newer version.
* **Practical Implication:** This data is crucial for understanding model reliability and for techniques like activation steering or uncertainty quantification. It shows that a model's "confidence" is not a single value but a dynamic property that varies by layer, evaluation method, and the specific knowledge domain (dataset). The high A-Anchored rates, especially in v0.3, could be leveraged to detect when the model is being fed incorrect information, as its internal state remains highly uncertain.
DECODING INTELLIGENCE...