## Line Chart: EGA Performance Across Perturbations
### Overview
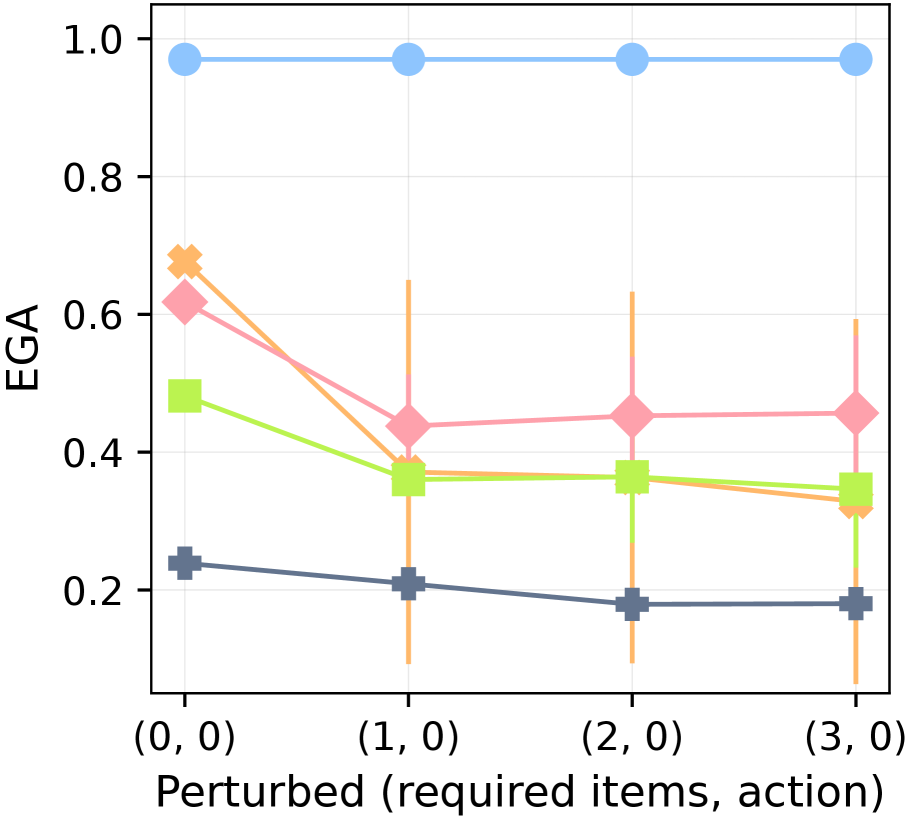
The chart displays four data series representing EGA (Expected Goal Achievement) performance across different perturbation scenarios. The x-axis represents perturbation states (0-3 required items with action 0), while the y-axis shows EGA values from 0.0 to 1.0. The "Unperturbed" condition maintains perfect performance, while perturbed conditions show varying degrees of degradation.
### Components/Axes
- **X-axis**: Perturbed states labeled as (0,0), (1,0), (2,0), (3,0)
- **Y-axis**: EGA values (0.0-1.0)
- **Legend**:
- Blue circles: Unperturbed (1.0)
- Orange crosses: Item 1 perturbation
- Green squares: Item 2 perturbation
- Pink diamonds: Item 3 perturbation
### Detailed Analysis
1. **Unperturbed (Blue)**:
- Maintains perfect 1.0 EGA across all states
- No variation observed (flat line)
2. **Item 1 (Orange)**:
- Starts at ~0.65 at (0,0)
- Drops sharply to ~0.4 at (1,0)
- Fluctuates between 0.35-0.4 at (2,0) and (3,0)
3. **Item 2 (Green)**:
- Begins at ~0.5 at (0,0)
- Declines to ~0.35 at (1,0)
- Stabilizes around 0.35-0.4 at higher perturbation states
4. **Item 3 (Pink)**:
- Initial value ~0.6 at (0,0)
- Drops to ~0.4 at (1,0)
- Shows slight recovery to ~0.45 at (2,0) and (3,0)
### Key Observations
- **Unperturbed dominance**: Perfect performance maintained regardless of perturbation states
- **Item 1 sensitivity**: Most significant initial performance drop (23% decrease from 0.65 to 0.4)
- **Partial recovery pattern**: Items 2 and 3 show modest improvement at higher perturbation states
- **Consistent degradation**: All perturbed conditions show EGA <0.5 compared to unperturbed
### Interpretation
The data demonstrates that perturbations (required items) negatively impact EGA performance, with Item 1 causing the most severe initial degradation. While Items 2 and 3 show partial recovery at higher perturbation states, none reach the unperturbed performance level. This suggests:
1. **Threshold effects**: Initial perturbations create performance cliffs
2. **Adaptation potential**: Slight recovery in Items 2/3 may indicate system resilience
3. **Item-specific impacts**: Different perturbation types create distinct performance trajectories
4. **Operational implications**: System design must account for perturbation tolerance thresholds
The consistent performance gap between unperturbed and perturbed conditions highlights the critical importance of maintaining system integrity under real-world operational constraints.